NeQter Labs User Manual
Reports
The Reports tool is used to see past events that have occurred on monitored systems and it is represented by a mail icon in the left navigation bar. From this page users are able to dismiss certain events, retrieve information about events as well as get a general overview of events stored on the system or monitors that have been setup on the Network Monitor page under Hosts. Users are also able to create new alerts as well as reports via the reports tool.
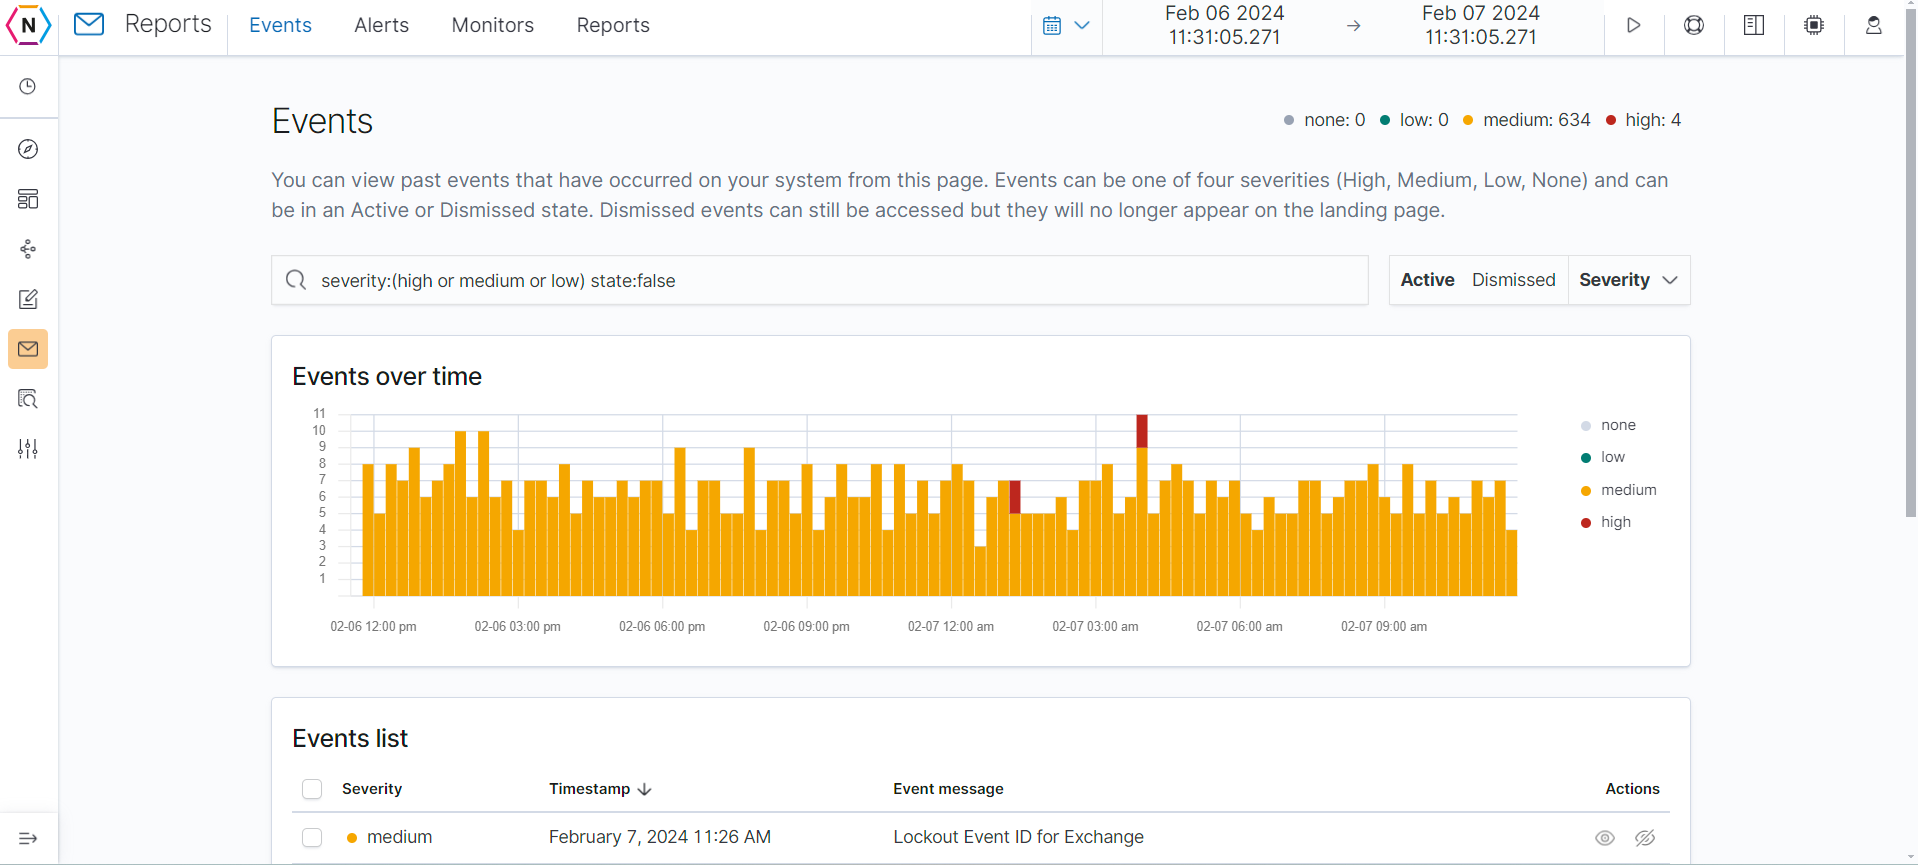
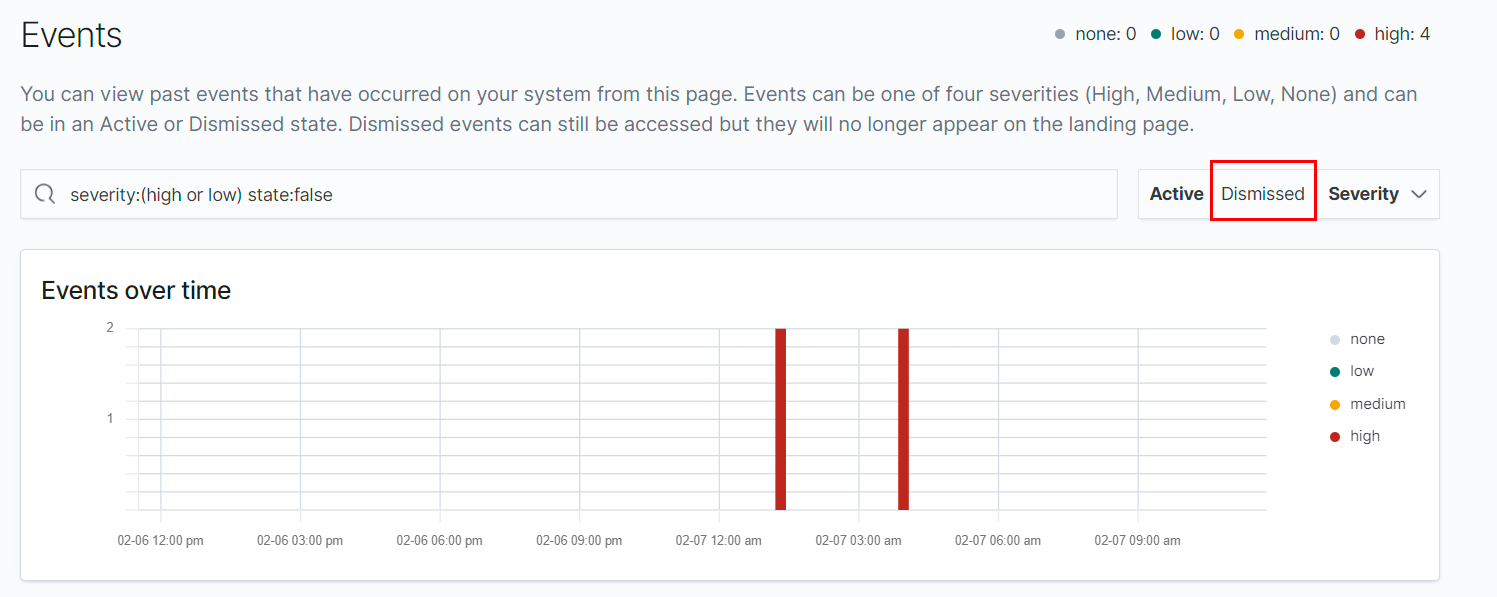
The first page users are brought to when opening the Report tool is a overview page of all events generated within the time frame listed on the top right. Users are able to sort these generated events by severity, Time and Event message. Users can also be switch between seeing active and dismissed event indices by clicking the respective buttons on the top right as well.
Filtering by Severity
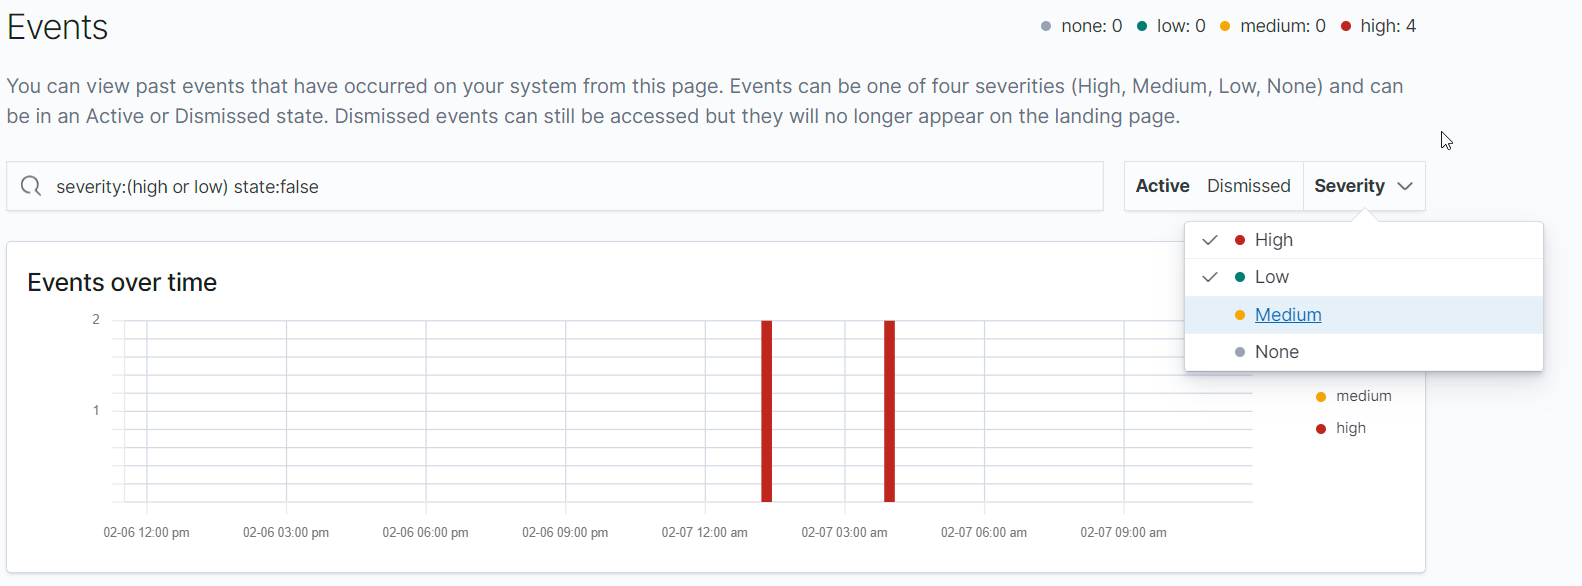
Events can be sorted by severity by going to the top right of the page and clicking on the severity drop down menu. Here users are able to choose what events based on severity they’d like to have shown on the page. By default Low, Medium and High severity events are shown.
Dismissing Events
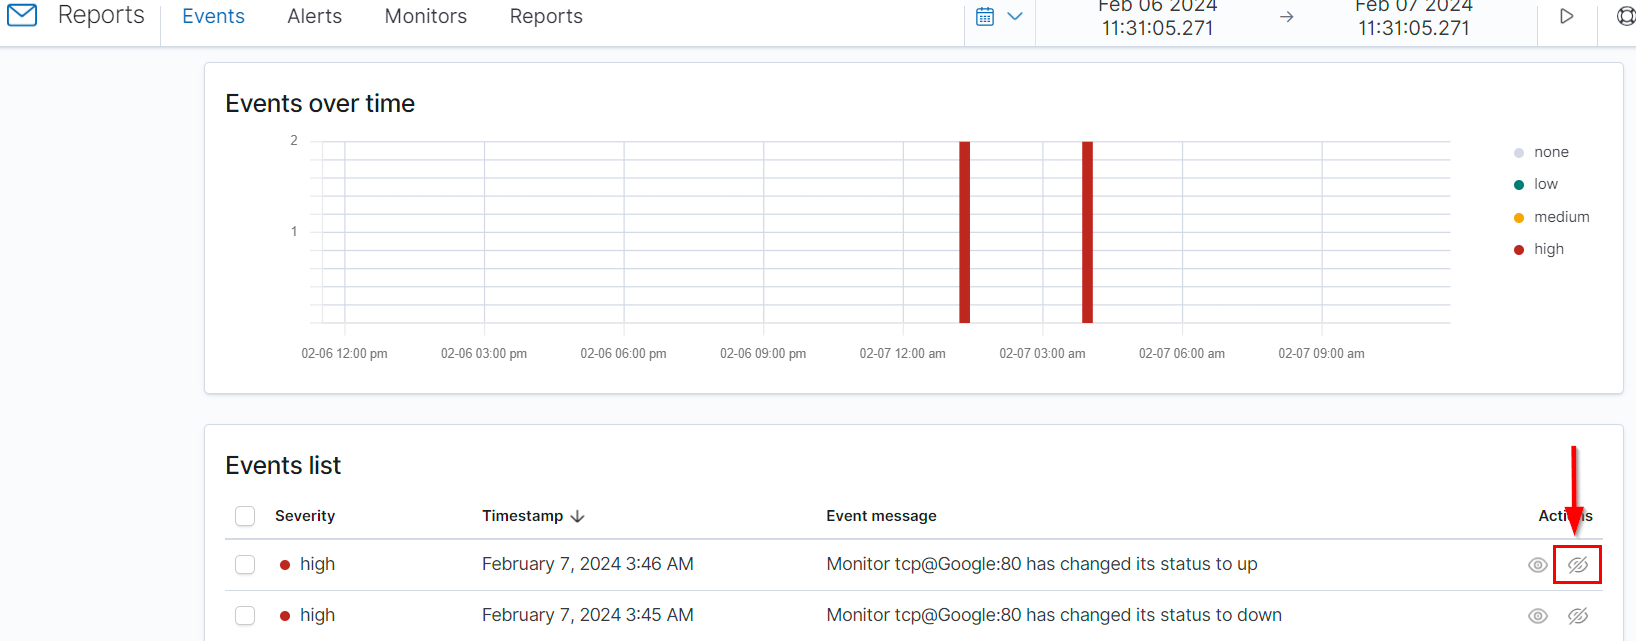
Events are able to be Dismissed which places the dismissed event on the dismissed listing and off the active listing which can be useful for clearing up the event page. To dismiss an event, click the Dismiss icon located on the right most column of the event listing (It will look like a eye with a slash through it).
If the event needs to be accessed again after being dismissed, the dismissed event can be found by clicking Dismissed on the top right and it should be noted that once an event is dismissed it can’t be returned to the active listing.
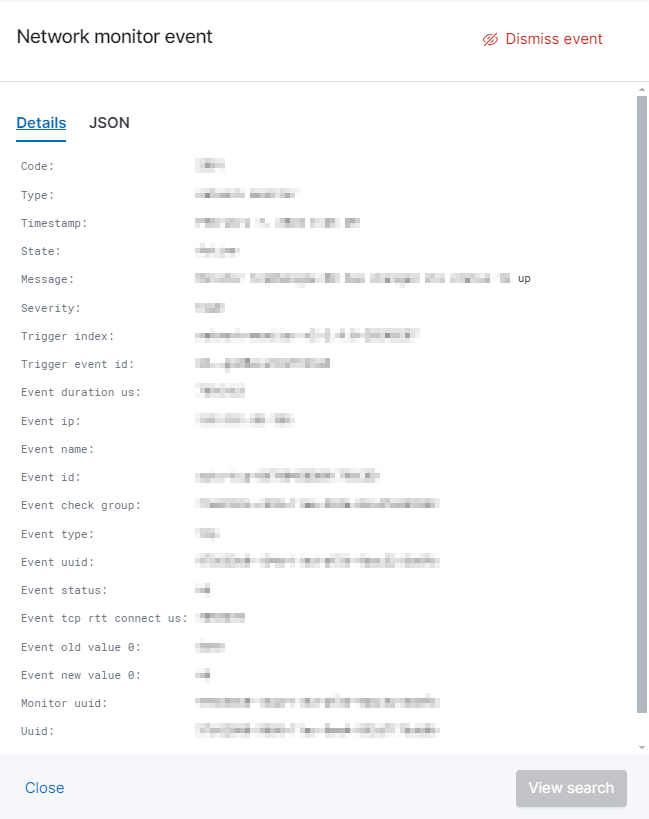
Viewing Additional Info
Clicking on the View Additional Information Button (An Eye with no slash) on the right most column will bring up any relevant data on the specific event including its Event Message, Severity, State (whether it’s active or dismissed), timestamp, Host IP and Status, Index, Type as well as the ability to search for more information if necessary via the View Search button on the bottom right.
Alerts
The Alerts page is where alerts can be added, edited or removed. Alerts when triggered are used to generate events for the event page as well as send out email alerts to users if configured.
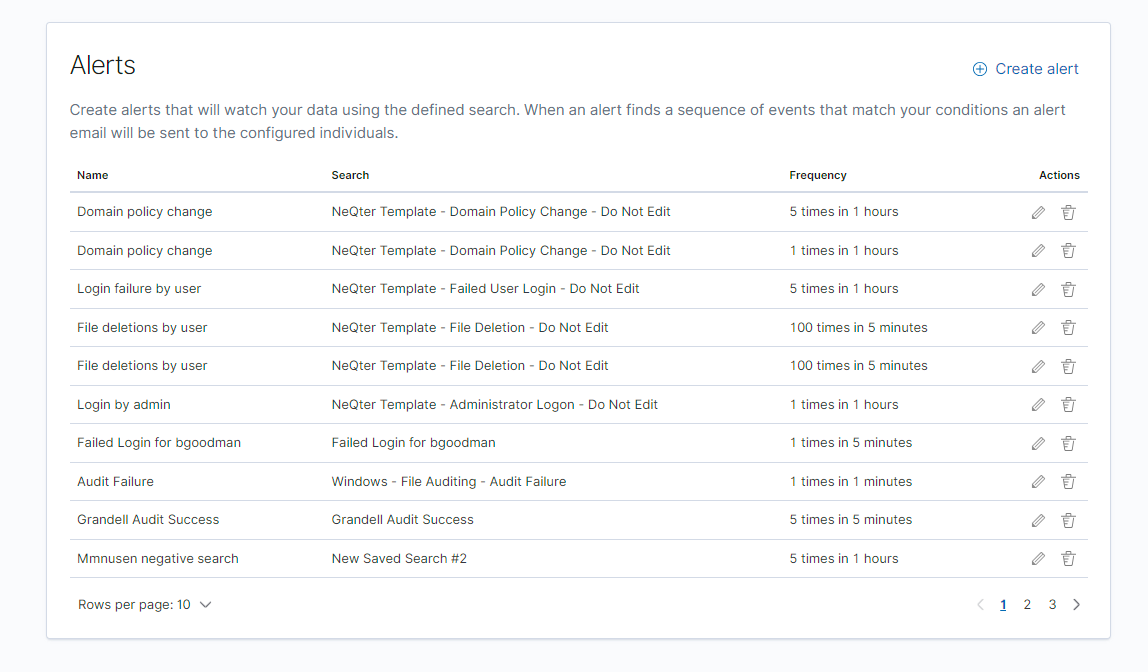
To create an alert, press the Create Alert button on the top right. Clicking on From a saved search will bring up a blank template page from which users can create an alert from scartch while clicking on From a template will bring up a list of pre-made templates which are available for use. Clicking any one of the templates will bring up their respective template page.
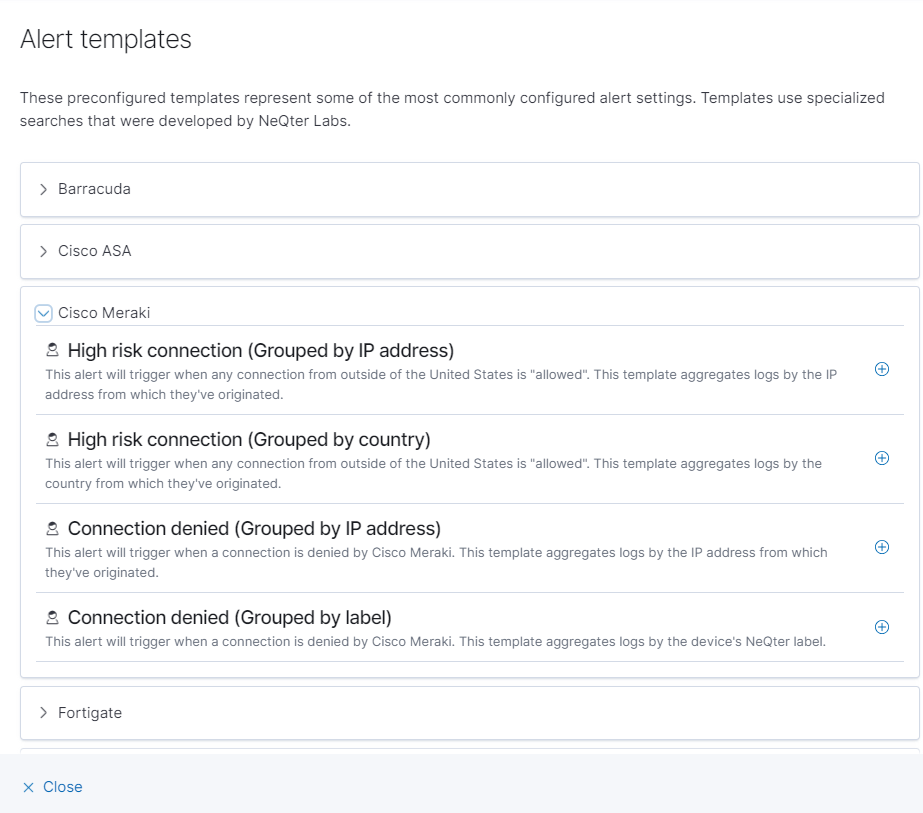
When creating an alert from a blank template or using a template the a slide-out window will pop out like seen below:
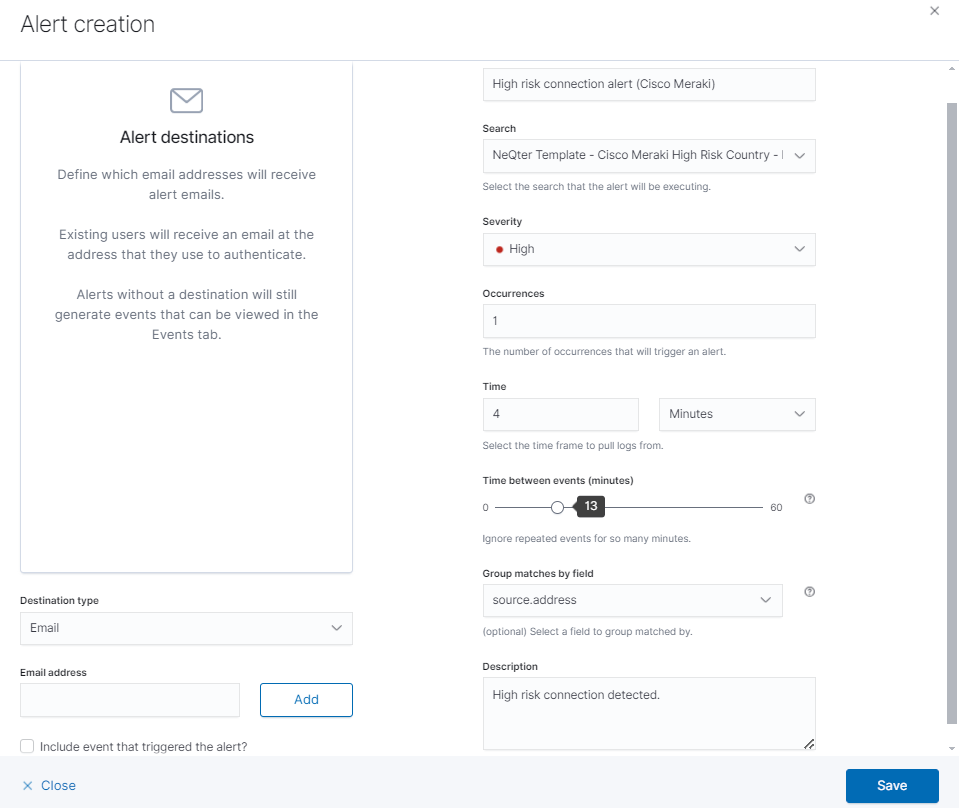
Templates when used already have all of their sections such as search parameters, occurences, time frame and so on setup that way users can quickly apply and use these pre-generated alerts without needing to set anything up outside of possibly email. Users can either run with the pre-configured information or use these alerts as a foundation for the creation of a more customized alert instead. Below is a list of configurations that can be changed and/or filled:
Name: The name of the new alert / event. It is suggested that the alert is given a name that is both easily readable and something that can be quickly glanced at and give a rough idea as to what the alert is covering.
Search: Search is the search parameters used to generate an event via this alert, for more information on how to create saved searches for this purpose see our Discover section for more information.
Occurrences: The number of times the search detects a specific type of log before triggering an alert.
Time: The time frame before occurrences resets, for example:
Setting occurrence to 2 and time to 3 Hours for example means that if two logs are detected within the span of three hours then an event is created.
Time Between Events (minutes): This configuration allows for a set “grace period” to follow each generated event before another can be generated via the same Alert.
for example if a period of 15 minutes is used and enough logs were discovered within that 15 minute period to typically generate 12 events, only the first event will be generated and the other 11 will be dropped. The logs can still be viewed in discover but no events will generate until the 15 minute period is over
Description: A short description to better explain what the Alert covers, this is optional.
Destination type & User / Email: Where users can select and input where they’d like to have events sent out to via email. Users can either directly input their email or use an emailed associated with a user account on the NeQter Device. It should be noted that with this section left blank or filled the box will still generate events and populate the event table.
Include event that triggered the alert: If selected then not only will the email sent out to the email addresses that were specified say that a new event has been generated but also send a report of the specific event detailing what exactly happened.
Once finished customizing the Alert, click Save on the bottom right of the page and a new alert will be added to the alerts table. Users are able to edit already created alerts by clicking on the Edit button (Pencil icon) next to the alert name as well as delete alerts by clicking the Delete (Trashcan icon).
Monitors
The Monitors page is used to check the status of network monitors that are currently setup on the Network Monitor page. Users are also able to set a specific email / user to receive alerts via email by either putting in the email address or using a user account’s associated email address found on the NeQter Device.
Another application found on this page is the ability to quickly enable alerts for any monitor changes by clicking on the checkbox in the Alert Field of the monitor under the Active monitors index.
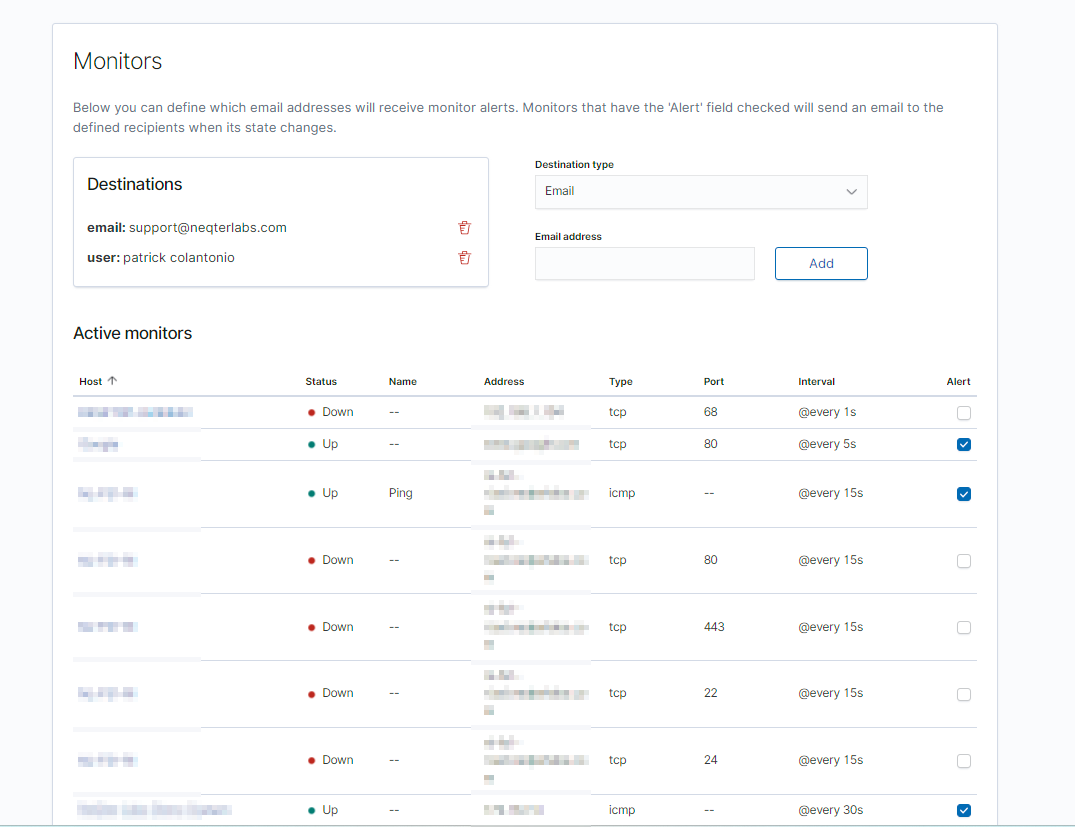
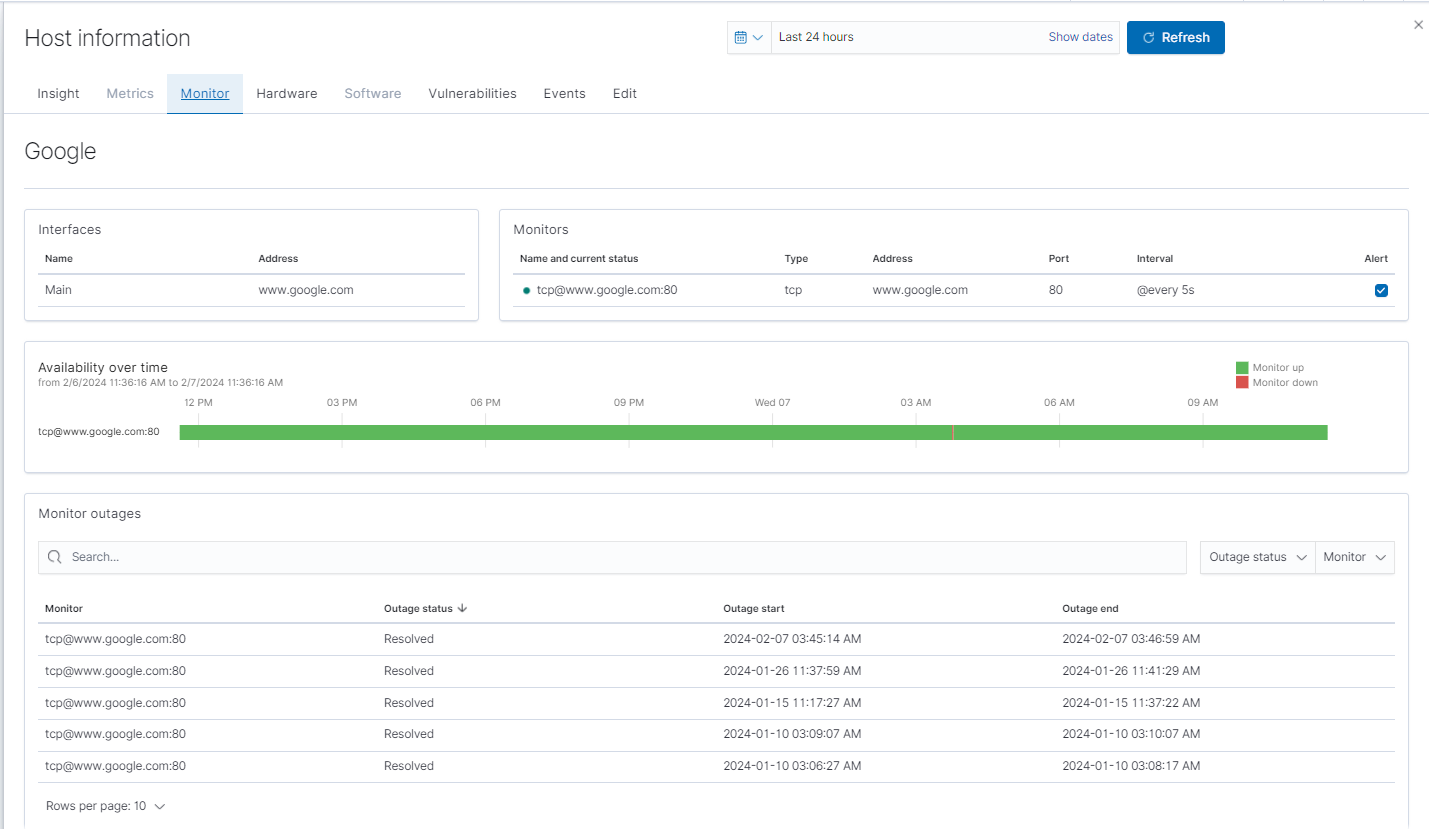
Lastly users are able to access monitor information by clicking on the monitor name found under the active monitors index which gives a more in depth overview of the monitor’s status history. For more information about network monitors go to our documentation page here.
Reports
The Reports tool allows users to view previously generated reports as well as generate / schedule new reports. Reports offer a snapshot of different portions of the NeQter Tool, below is a list of reports NeQter has to offer:
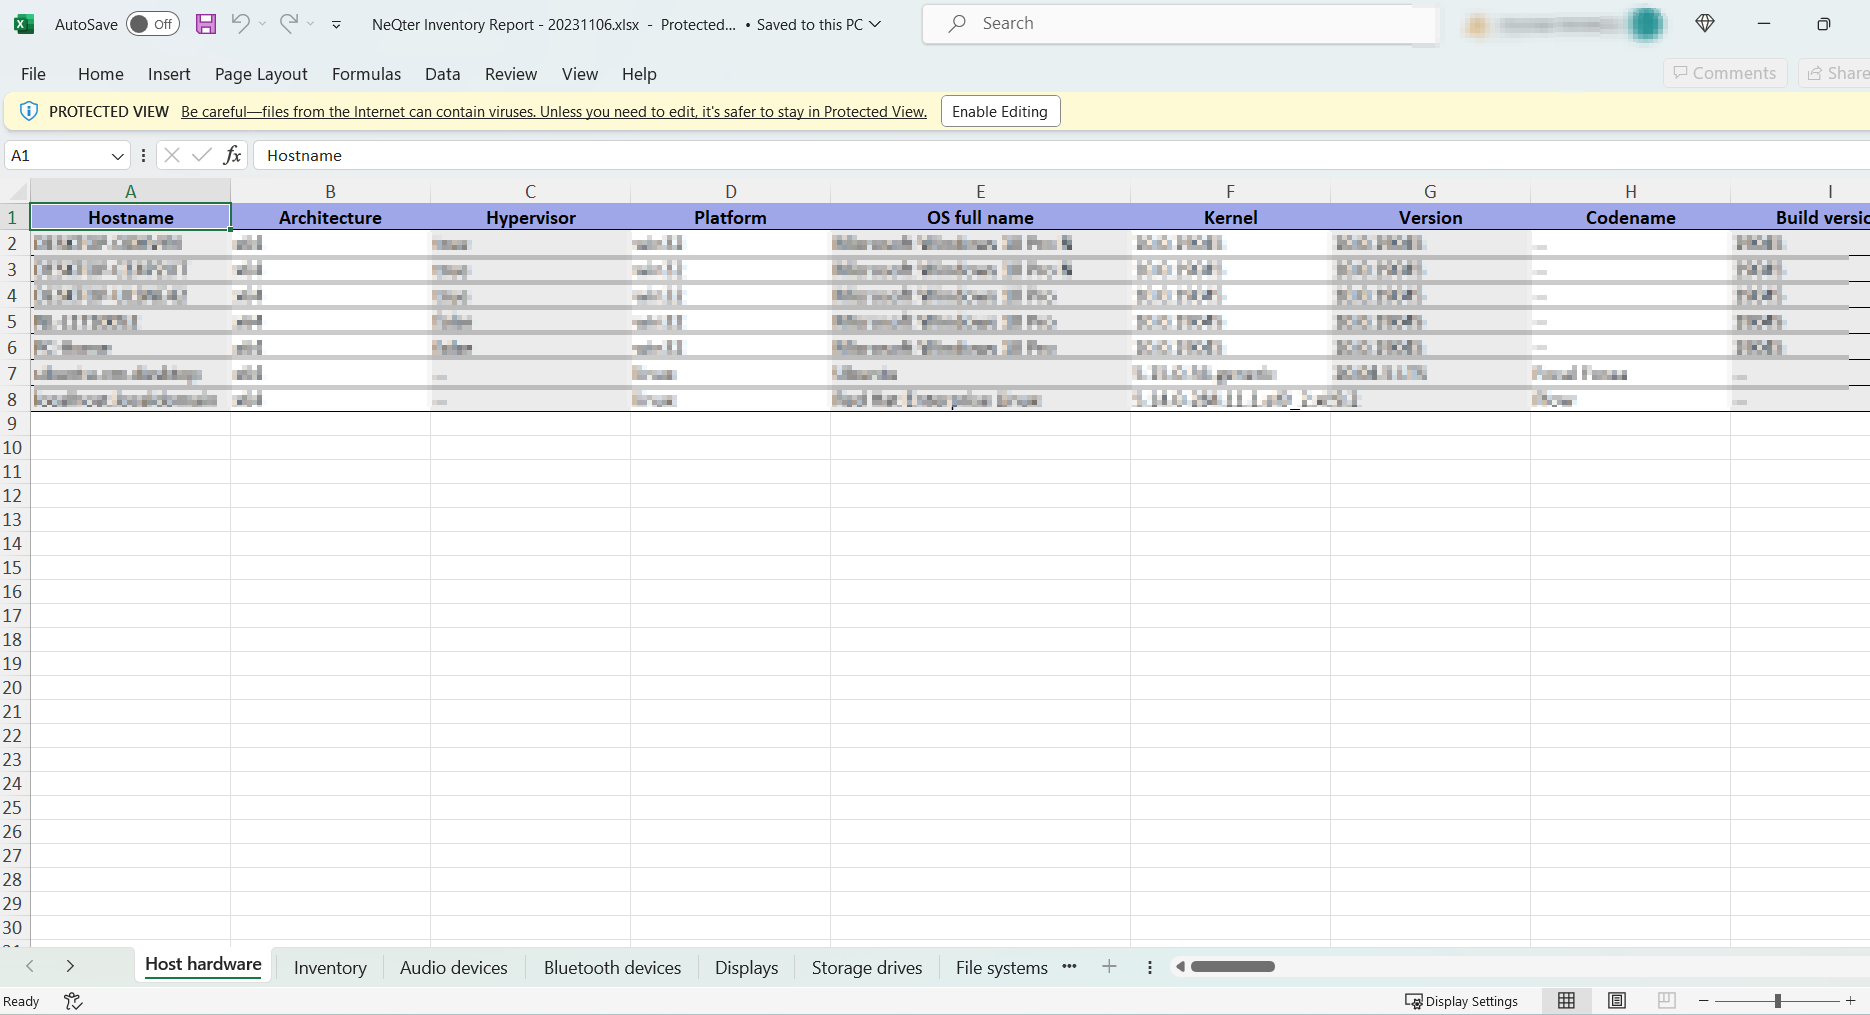
Full Inventory Report: This can be used to take a daily, weekly or monthly automated Inventory Report printout.
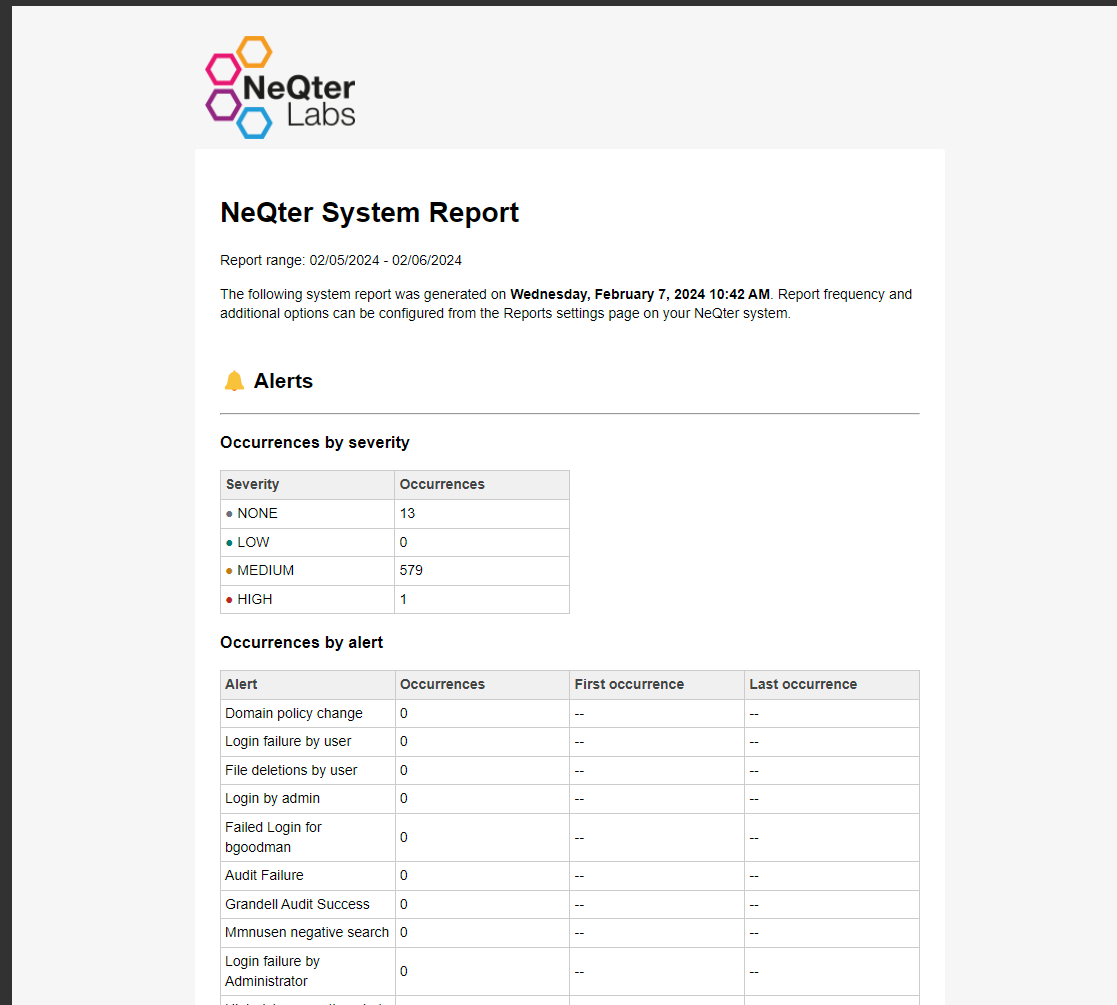
General System Report: A report going over the overall status of the NeQter Device. It includes a list of changes in the Compliance Tool, Events over the last day/week/month and Monitor changes.
Custom Report: Utilizing Saved Searches created in the Discover page this report can generate a printout based on saved searches on the NeQter System.
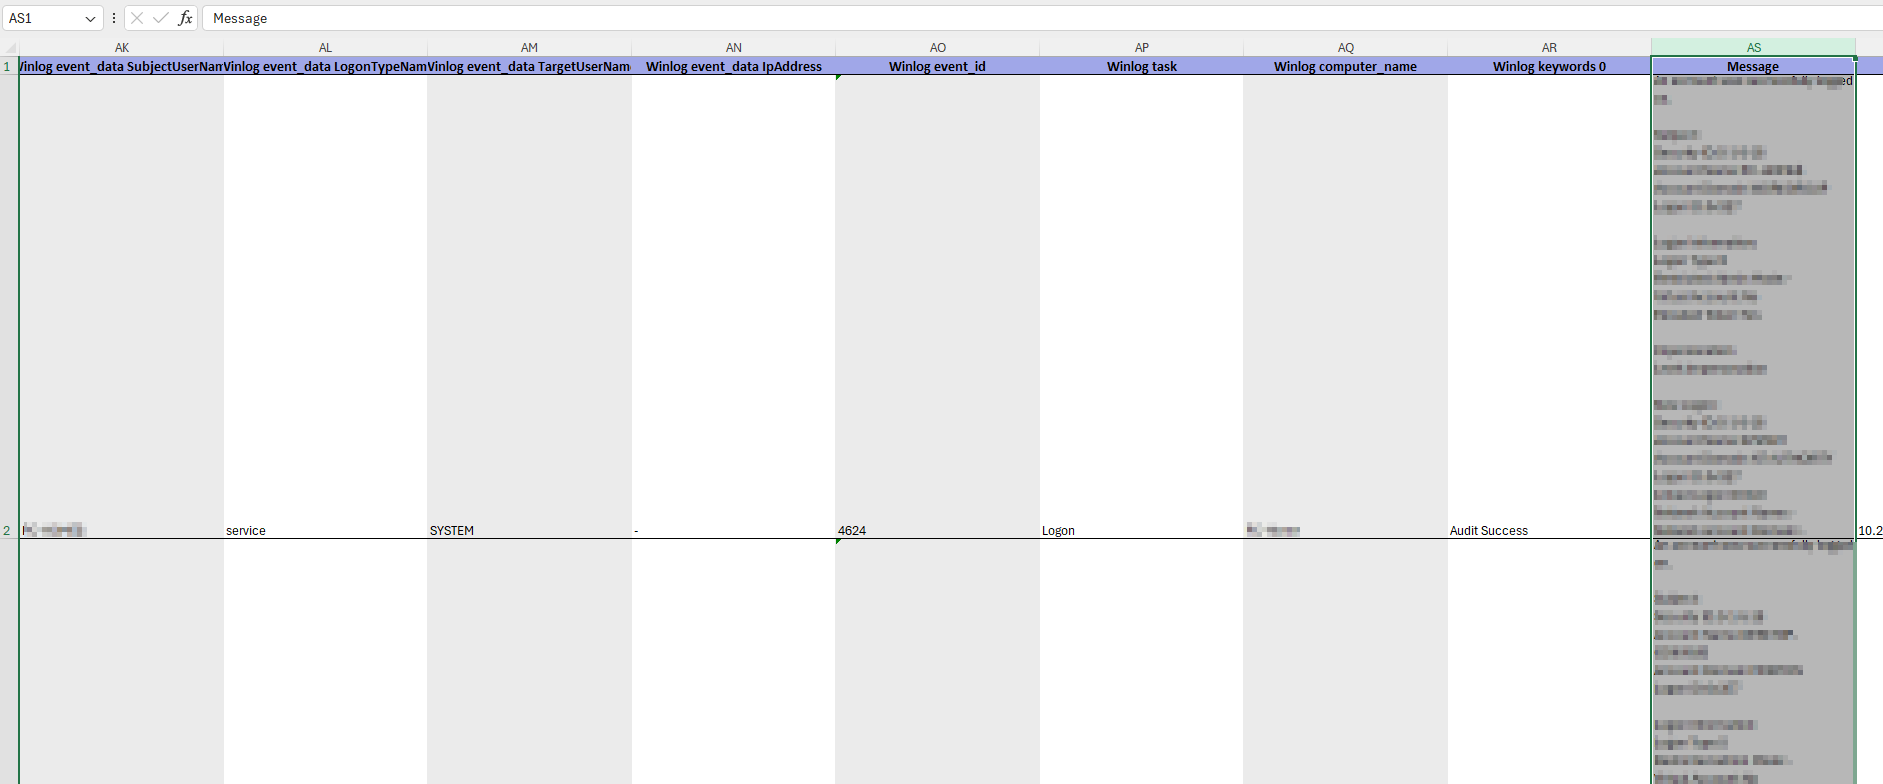
Vulnerability report by host: Utilizing Saved Searches created in the Discover page this report can generate a printout based on saved searches on the NeQter System.
Vulnerability report by results: Utilizing Saved Searches created in the Discover page this report can generate a printout based on saved searches on the NeQter System.
These reports can be generated by either by clicking New schedule on the Reports tab or by clicking on the “Arrow” icon on the top left of the nav bar (this can be viewed on any page in NeQter).
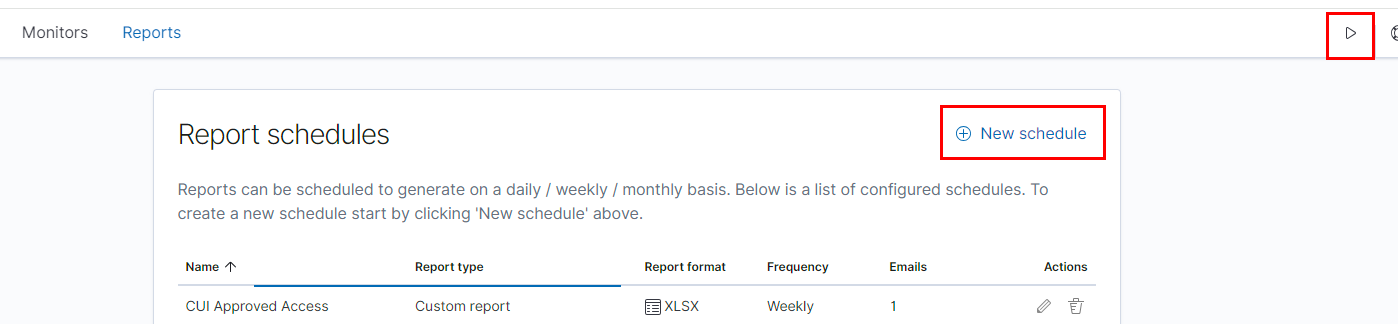
NOTICE: One key difference between using the Arrow icon to generate a report and using New schedule button instead is that the arrow key is not able to create automated scheduled reports whilst the New schedule button will.
When creating a new report a slide out will appear which will allow for configuration of the report. Each report will have different configurations with descriptions attached going over what is being covered by that configuration and what is configurable in a report will vary depending on the type of report. Below is an example of a General System Report configuration:
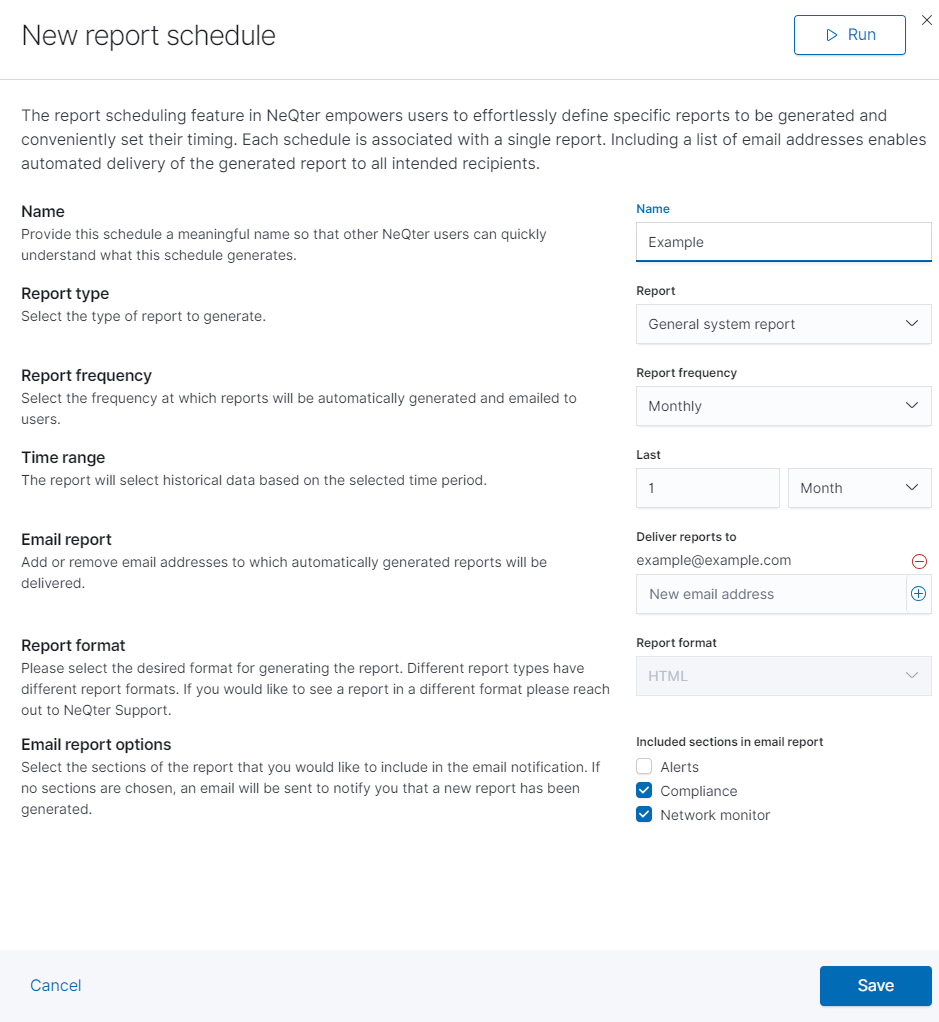
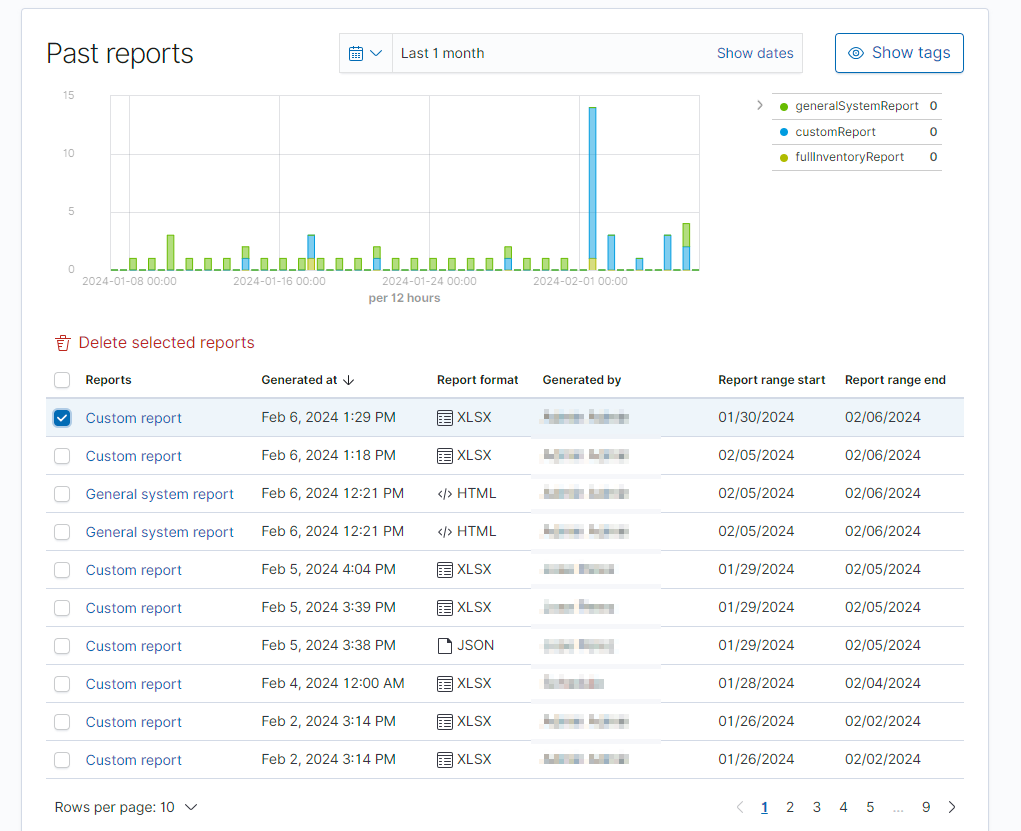
Once a report is ready to be generated click Save for a scheduled report or Run for a on-demand report. Now if it is a on-demand report it will either download the report or create a preview window depending on the type of report which can also be downloaded. Any reports already generated can be viewed in the Past reports section of the Reports page. Reports can be sorted via the different columns attached, time & tags as well as deleted.
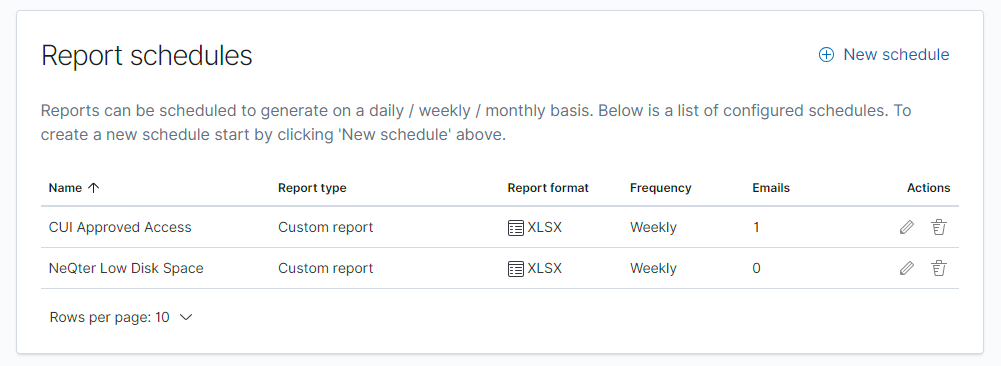
If the report is a scheduled report then it will create a entry under the Report schedules section of the Reports page. This section will contain all scheduled report created and it is from here users are able to edit schedule reports or delete them.