NeQter Labs User Manual
Table of Contents
Navigating the Agent Manager
One of the main tools utilized by the Hosts page is the Agent Manager. The Agent Manager Tool is used to both configure neqter agents on local devices as well as gather information from local device via the neqter agents. Some of the information gathered from the local agents are software and hardware information found on the local device, windows event logs and audit information.
In order to retrieve local data from the Agent Manager Tool you will first need to have agents installed on the local devices you’d like to monitor. You can download the Agent Manager Setup File by clicking on the link below:
Once you’ve downloaded the file you can follow the instructions found here to have the Agent Manager installed on a local device or you can follow the instructions here if you wish to have the agents deployed via a Group Policy Object.
We also have a Agent Manager for operating systems outside of Windows. Due to the MacOS and Linux Builds of the Local agent still being in development there are many bugs as well as some features missing that are present on the Windows Version of the Agent Manager.
NOTE: Only Debian Based Linux Systems are supported by NeQter.
Inventory
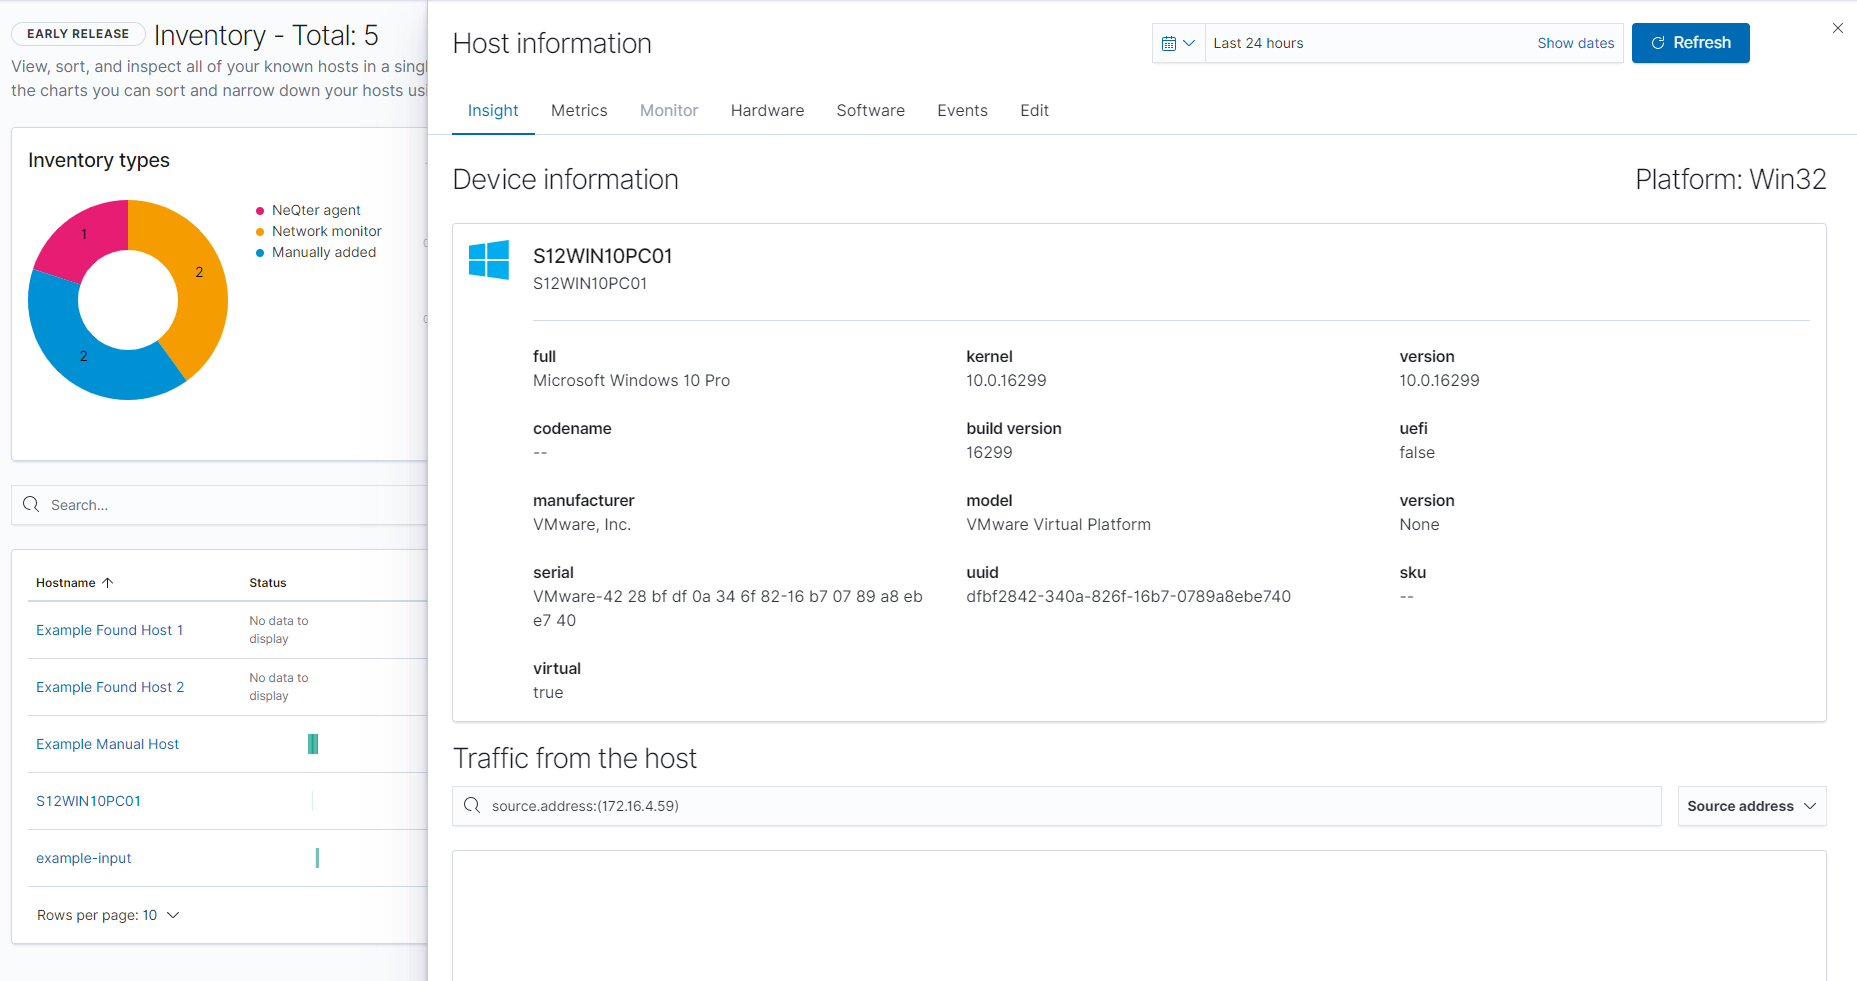
The first page you’ll be brought to when going onto the Hosts page is Inventory tab. The Inventory tab is a list of all devices you have currently inventoried. Devices with Agent Managers pushed out to them will automatically populate the inventory page alongside Devices listed under Inputs. Devices without an agent or a input on the input page will be able to be added to your inventory list via either the Monitor tool or adding devices discovered via your Vulnerability Scanner.
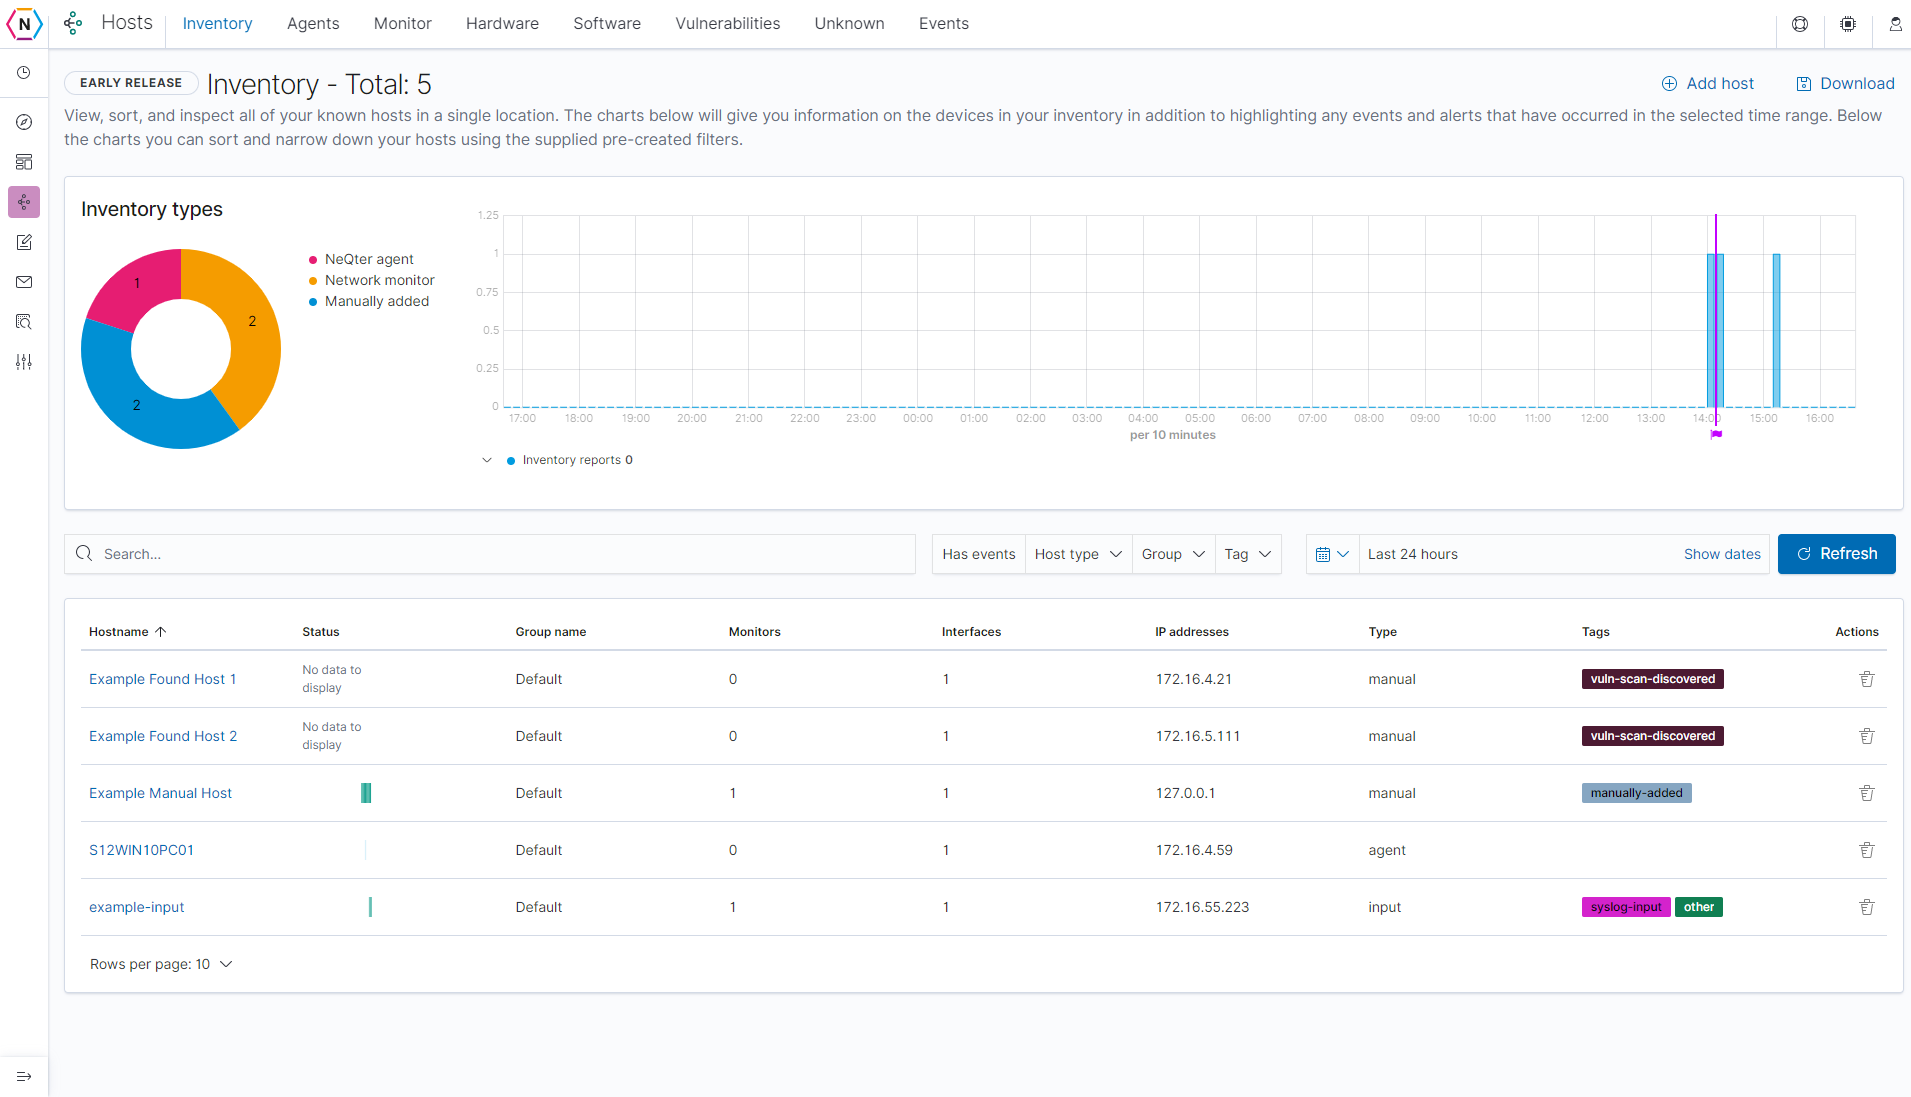
Once a device is listed on the Inventory page you can see all discovered information about that particular device including Hardware & Software information, Relevant Vulnerability Scan data and Logs collected. All devices collected are split up into three different categories (host types) and have the following data to present:
NeQter Agents / Agents: These types of devices are discovered and automatically inventoried via the NeQter Agent Manager Software. Information typically collected are Windows Log / File Audit data, Metrics, Hardware and Software Information alongside Vulnerability Scanner Data. More information can be found under the Agent Manager Section.
Network Monitors / Monitors: These types of devices are found via either manually adding them under the Monitor tab or by adding them on the Unknown tab. Monitors are able to collect Port Information, Vulnerabilities as well some very surface level device information.
Manually Added / Inputs: The last type of device is a device added via the Inputs page found under NeQter Settings. Information that is collected on these devices typically include Syslog Data and Vulnerabilities.
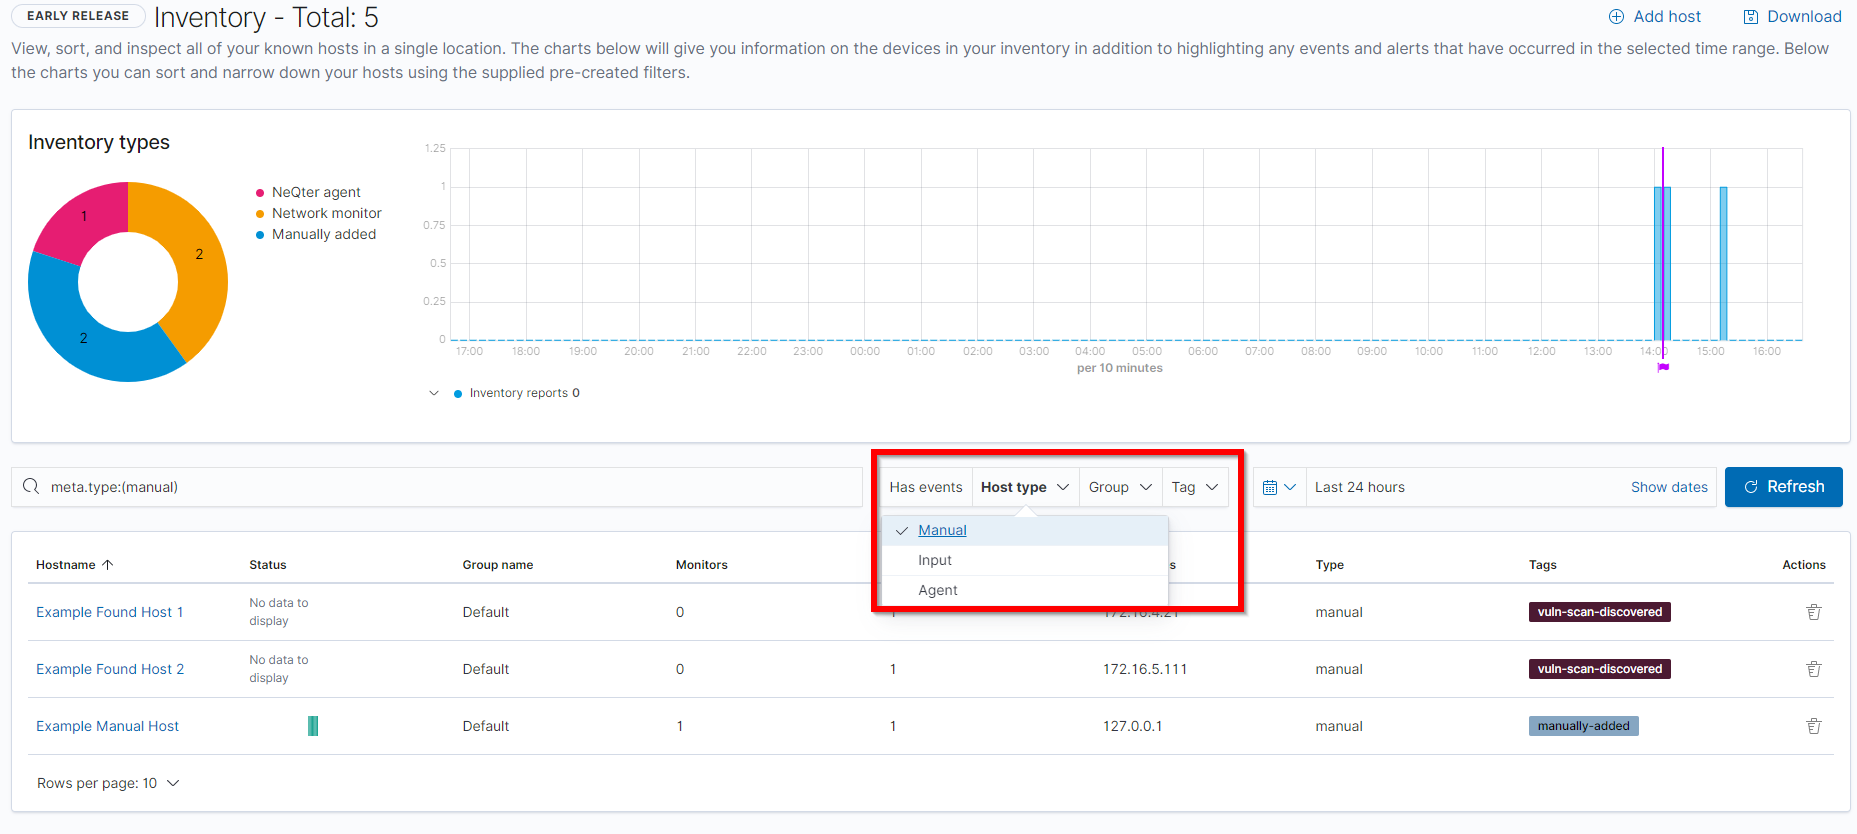
These categories can be sorted through via the Host Type filter on the top of the inventory table. You can also sort by group and tags as well.
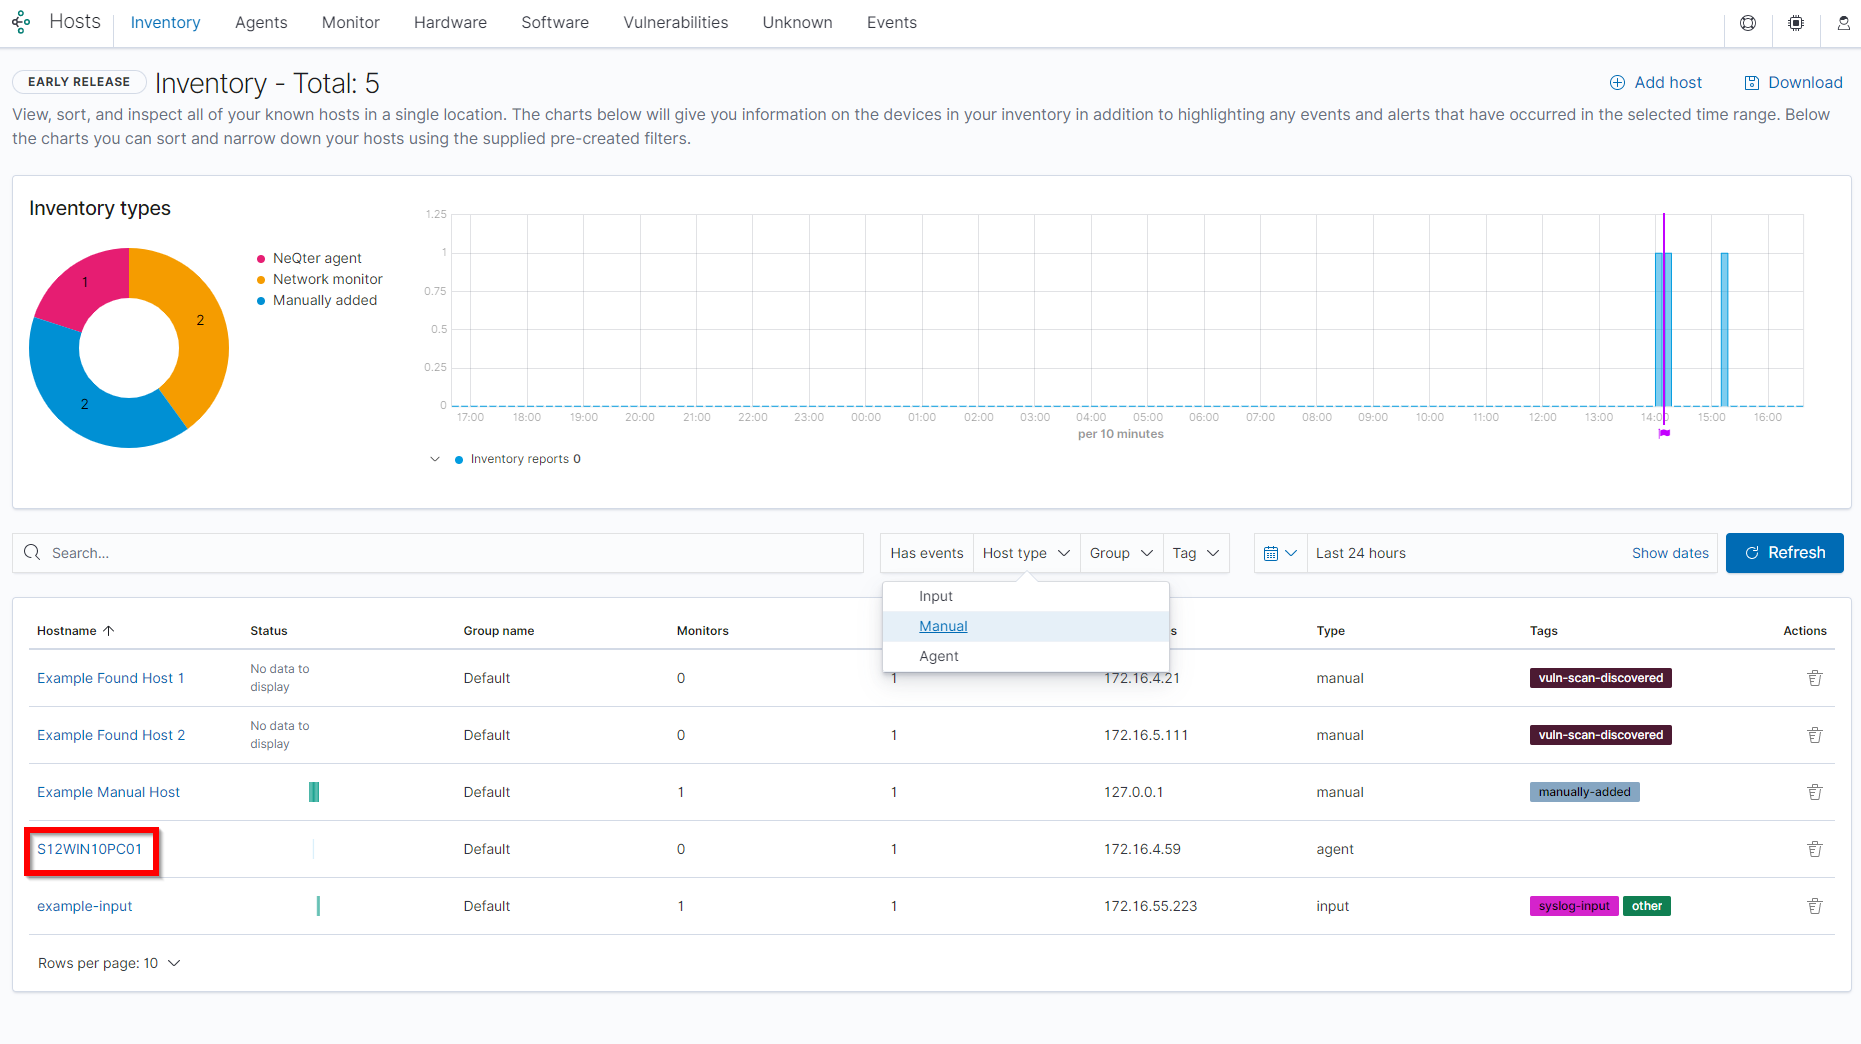
Outside of sorting for specific devices or Host Types you can also click on the hostname of a device to see its Host Information.
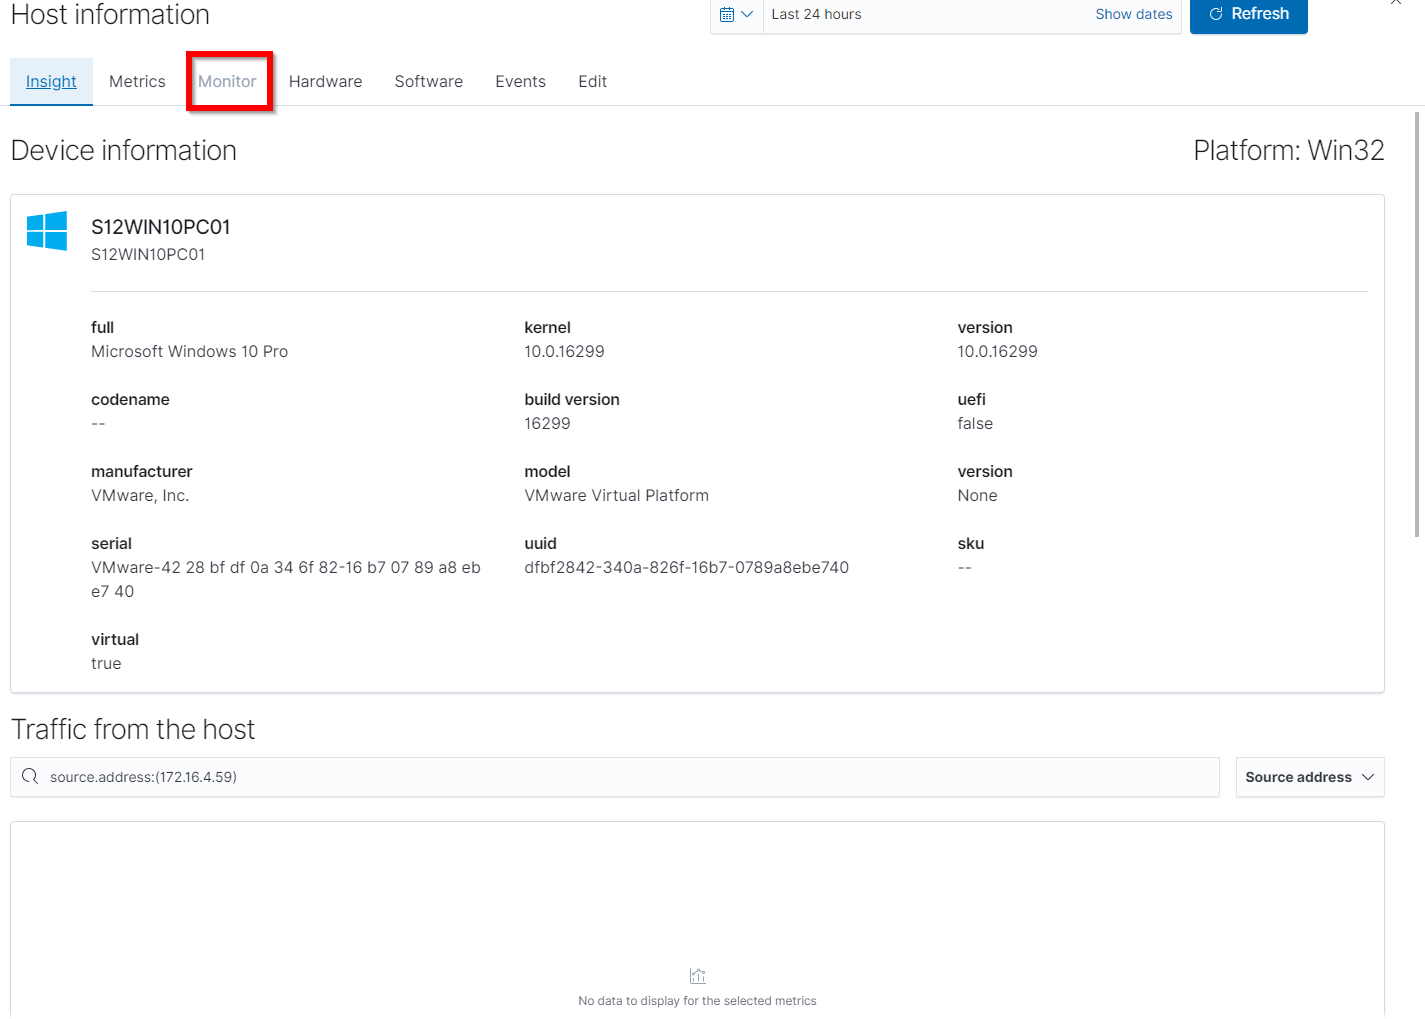
Depending on the type of host you can see different kinds of related logs and vulnerabilities of the host. If the device is using a NeQter Agent you can also see its metrics, hardware and software information as well.
If the device has a monitor attached to it you can also see its monitor data. For more information about monitors you can check the Monitor section of the documentation.
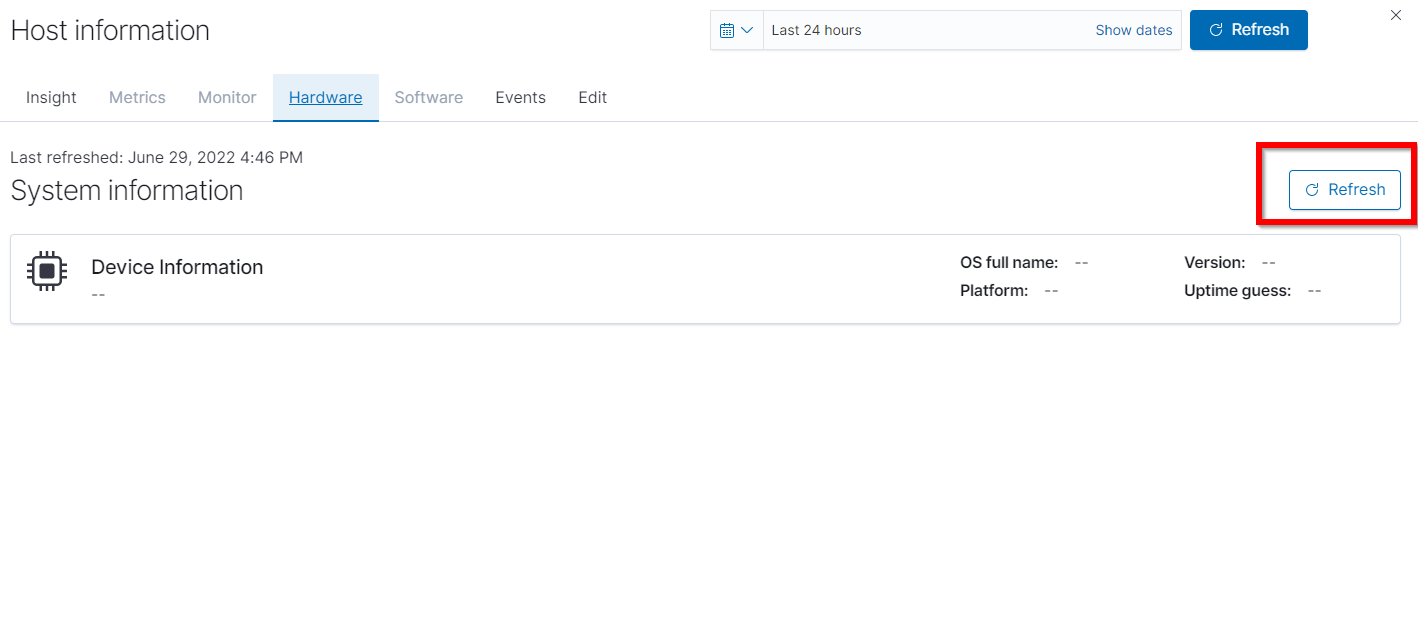
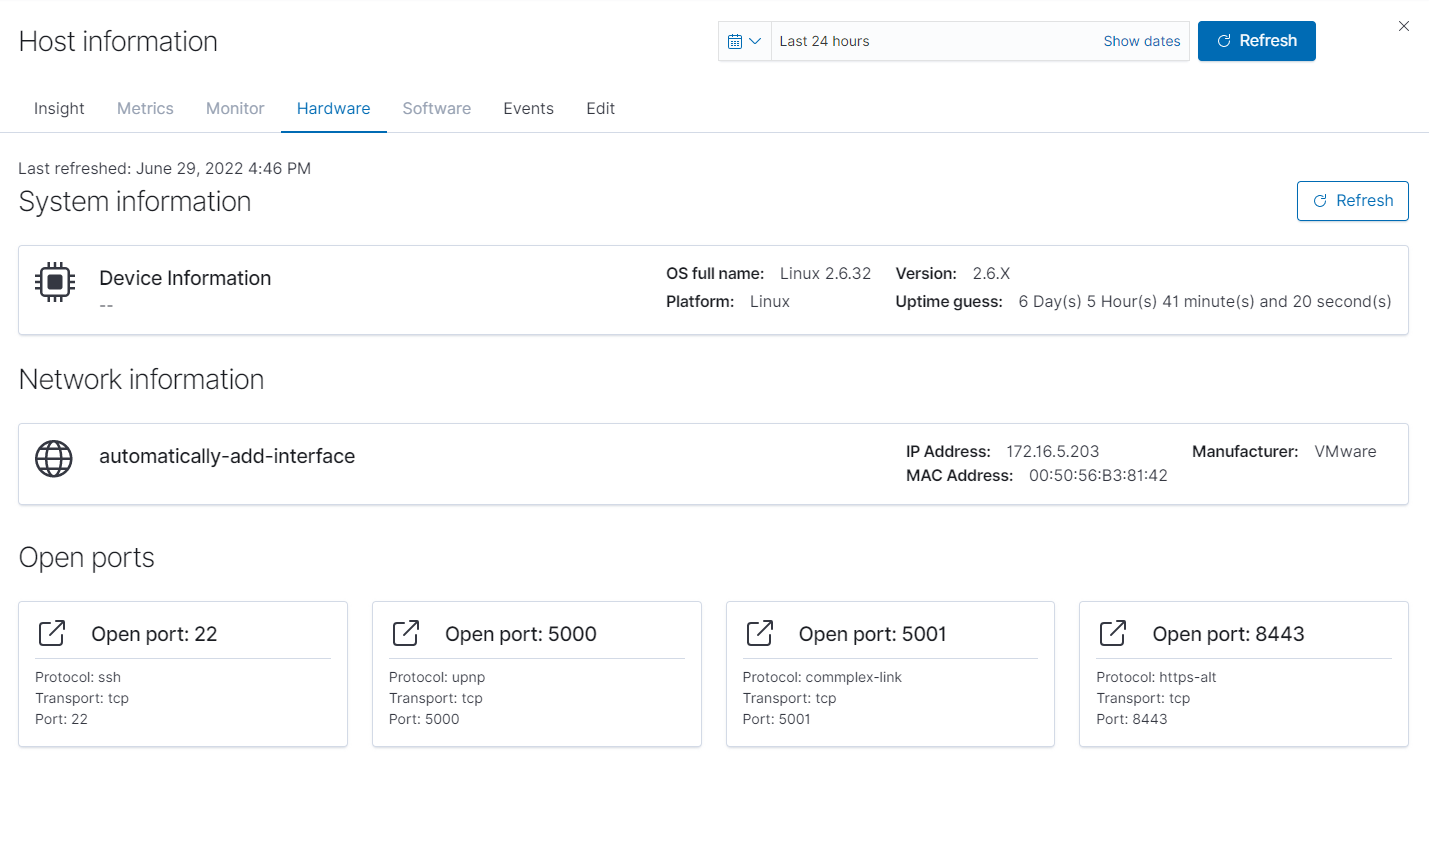
For devices not utilizing the agent manager you can go to the hardware section of their host information flyout to see open ports and data that was able to be scanned via the vulnerability scanner. In order to get this information however you will need to first click the Refresh button on the top right to begin a nmap scan.
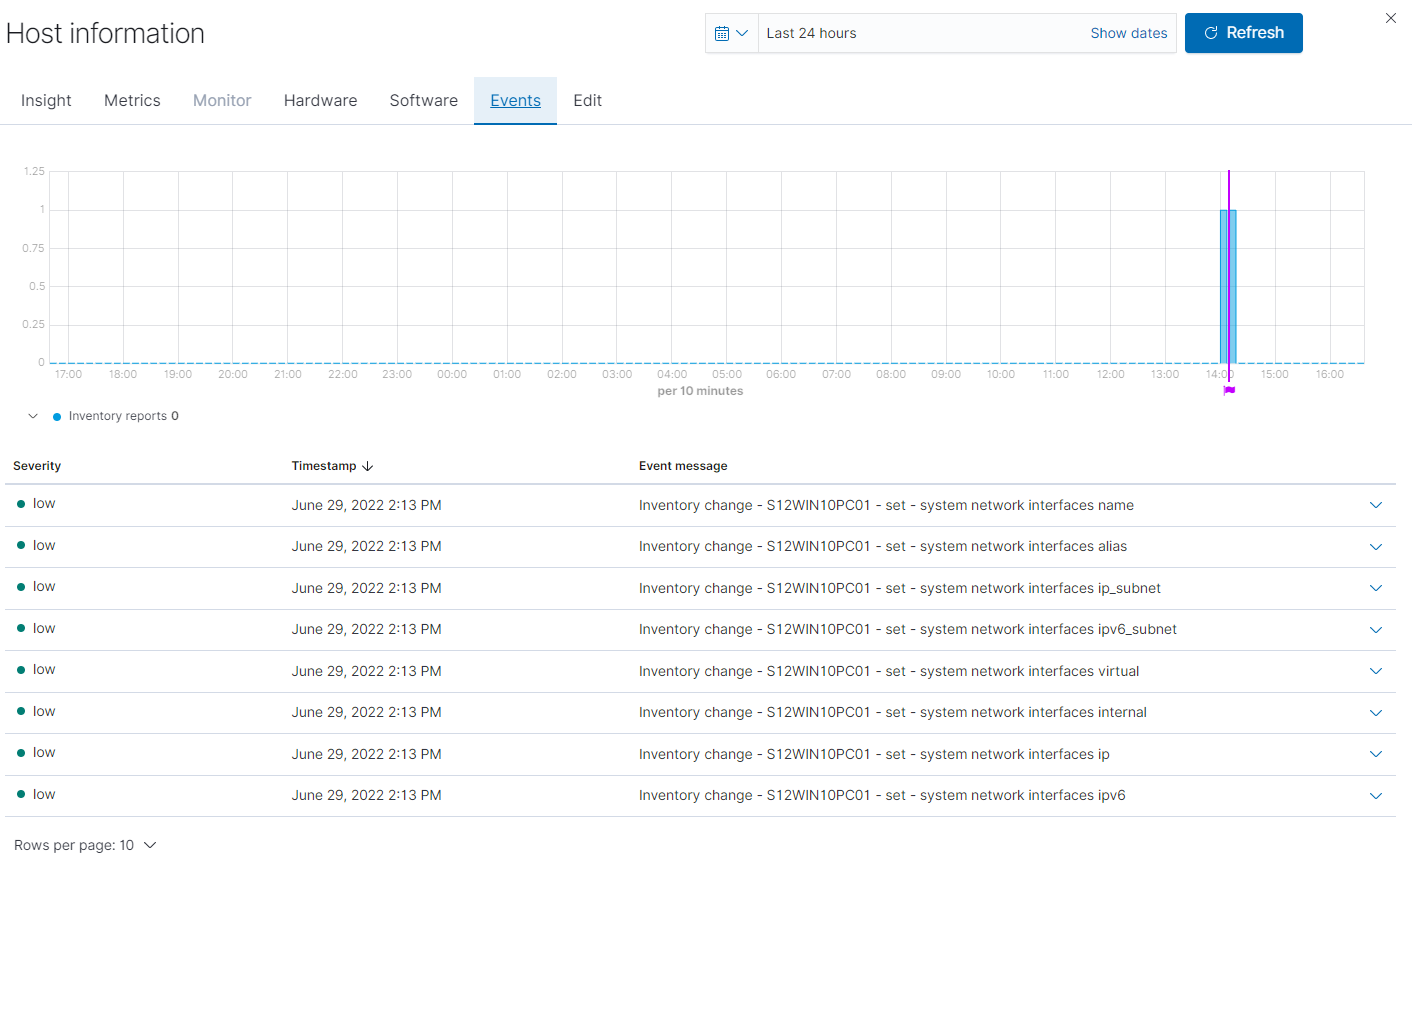
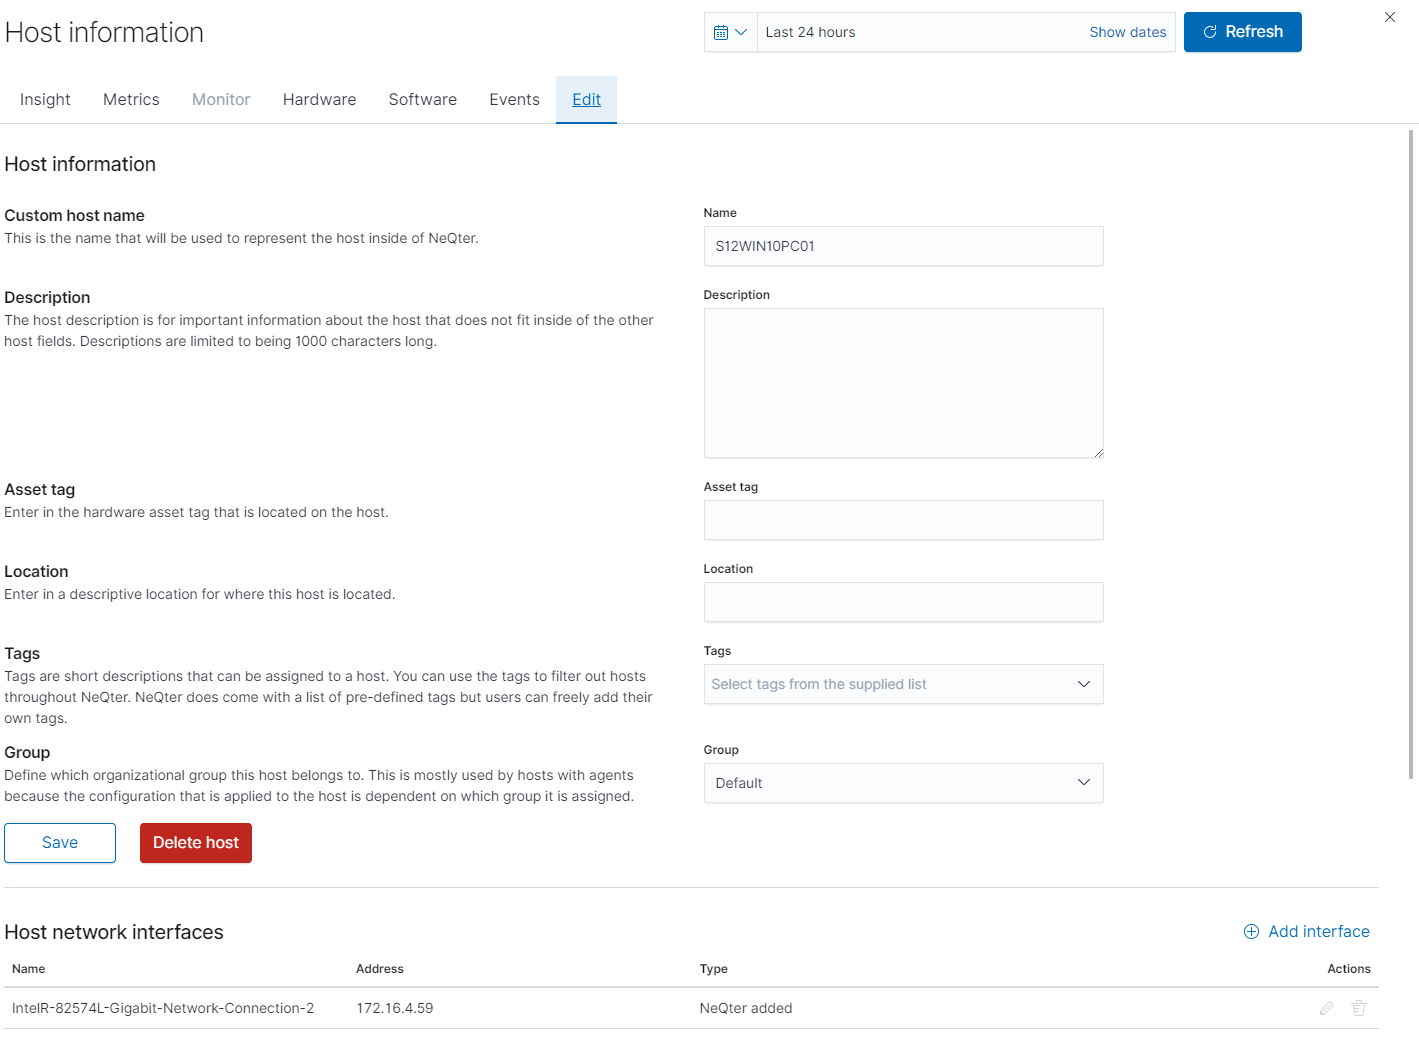
Lastly all device types will have a Events and Edit tab under their Host Information flyout. The Events tab will be linked to alerts as well as if applicable their audit tool. This allows users you quickly see related events for devices.
The Edit page meanwhile is where you can change information related to any particular device. This includes its hostname, description, asset tag, location, tag and group if it is from an Agent Manager. You are also able to setup Monitors from this page as well.
Agents
Under the Agent tab you are able to edit groups and assign devices that have an Agent Manager software installed on them across your network to different groups for organization and configuration. You are able configure different devices to send different types of information over to your NeQter device depending on what you need, this is to allow devices of different types (Domain Controller, Workstations, File Servers, etc) to have different configurations applied in a quick and easy manner.
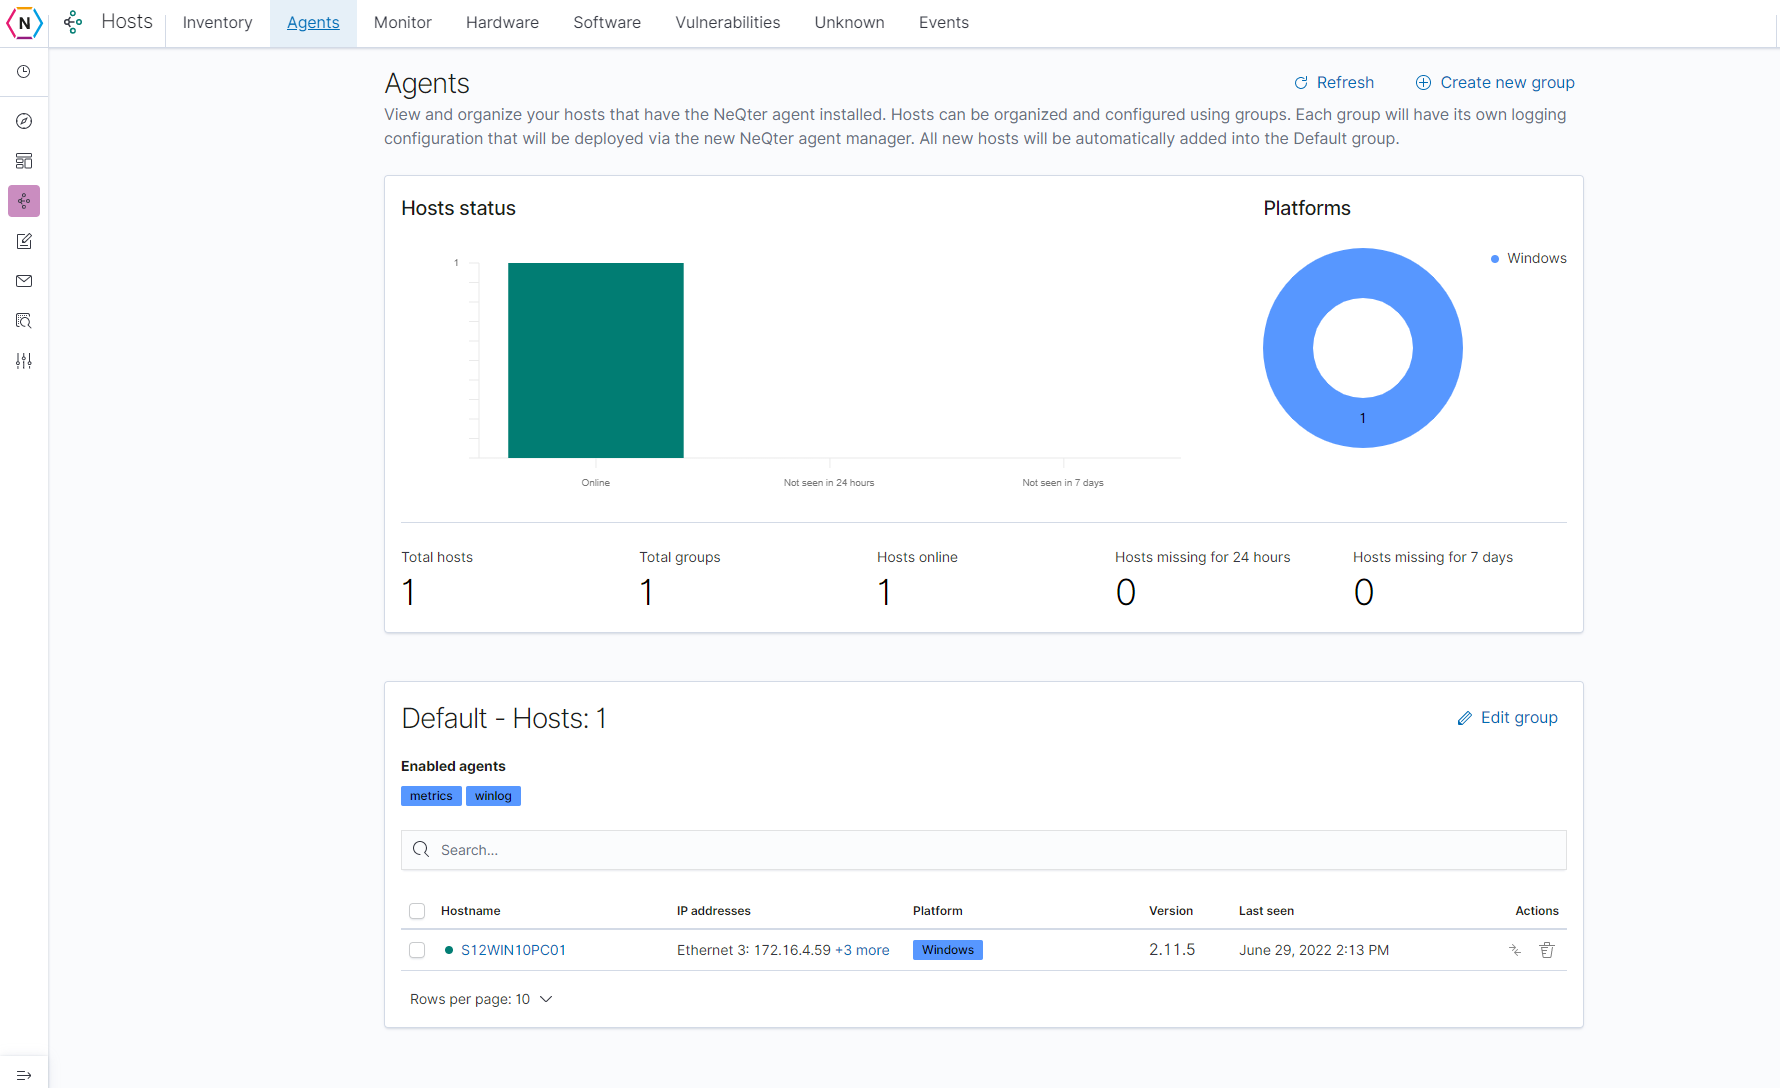
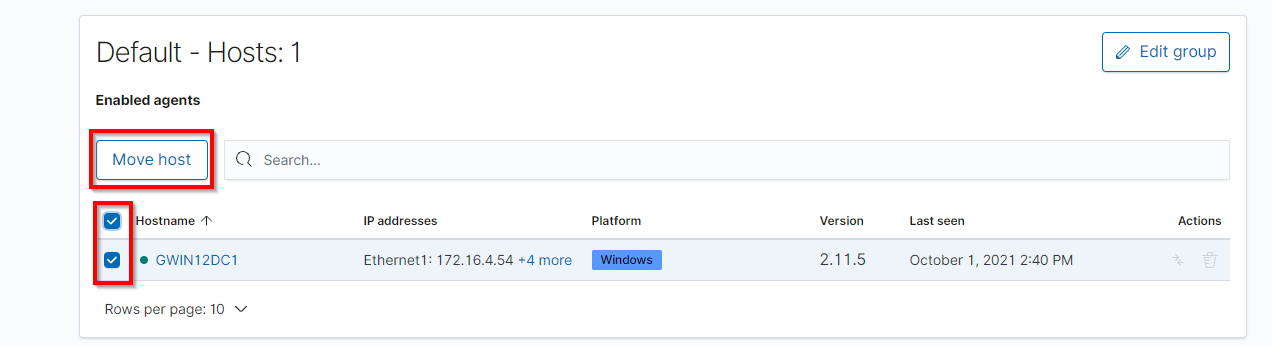
As devices are initially added to the neqter core’s Agent page they will be placed under the Default group to start. You are able to move devices to and from different groups by either clicking the transfer button found next to each device under the action column (icon with two arrows going in either direction) or by checking the boxes next to each of the devices you would like moved and clicking the Move host button on the top left of the group they are found in as shown below.
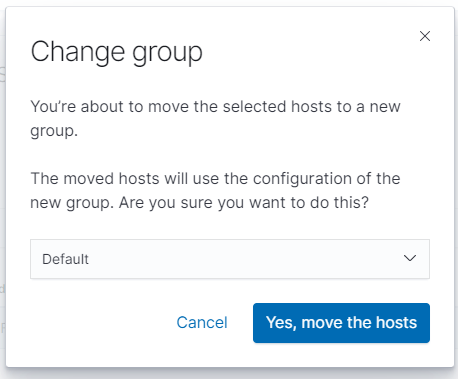
Either method used will bring you to the Change Group window which is where from the drop down you can select which group you’d like to have the devices moved to. Once the group you’d like to move the device to is selected, click the Yes, move the hosts button to apply the changes.
NOTE: You can also remove devices completely from the listing by clicking on the trashcan icon next to each device, please note that if the device still has an active agent it will repopulate the table until the agent is either turned off or no longer pointed towards the NeQter Core.
Once finished the host should now show up in the new group it was assigned to and when said host contacts the NeQter Core again for updates it will apply any changes made when switching to the new group (if one group has metrics turned on and the other doesn’t for example) to the local agent.
Lastly outside of moving devices to different group configurations and removing devices you are also able to click on each device’s Name to see more information about the device such as its operating system, hardware and software specifications, events and so on. For more information check out the Inventory section of the documentation.
Configuring Groups
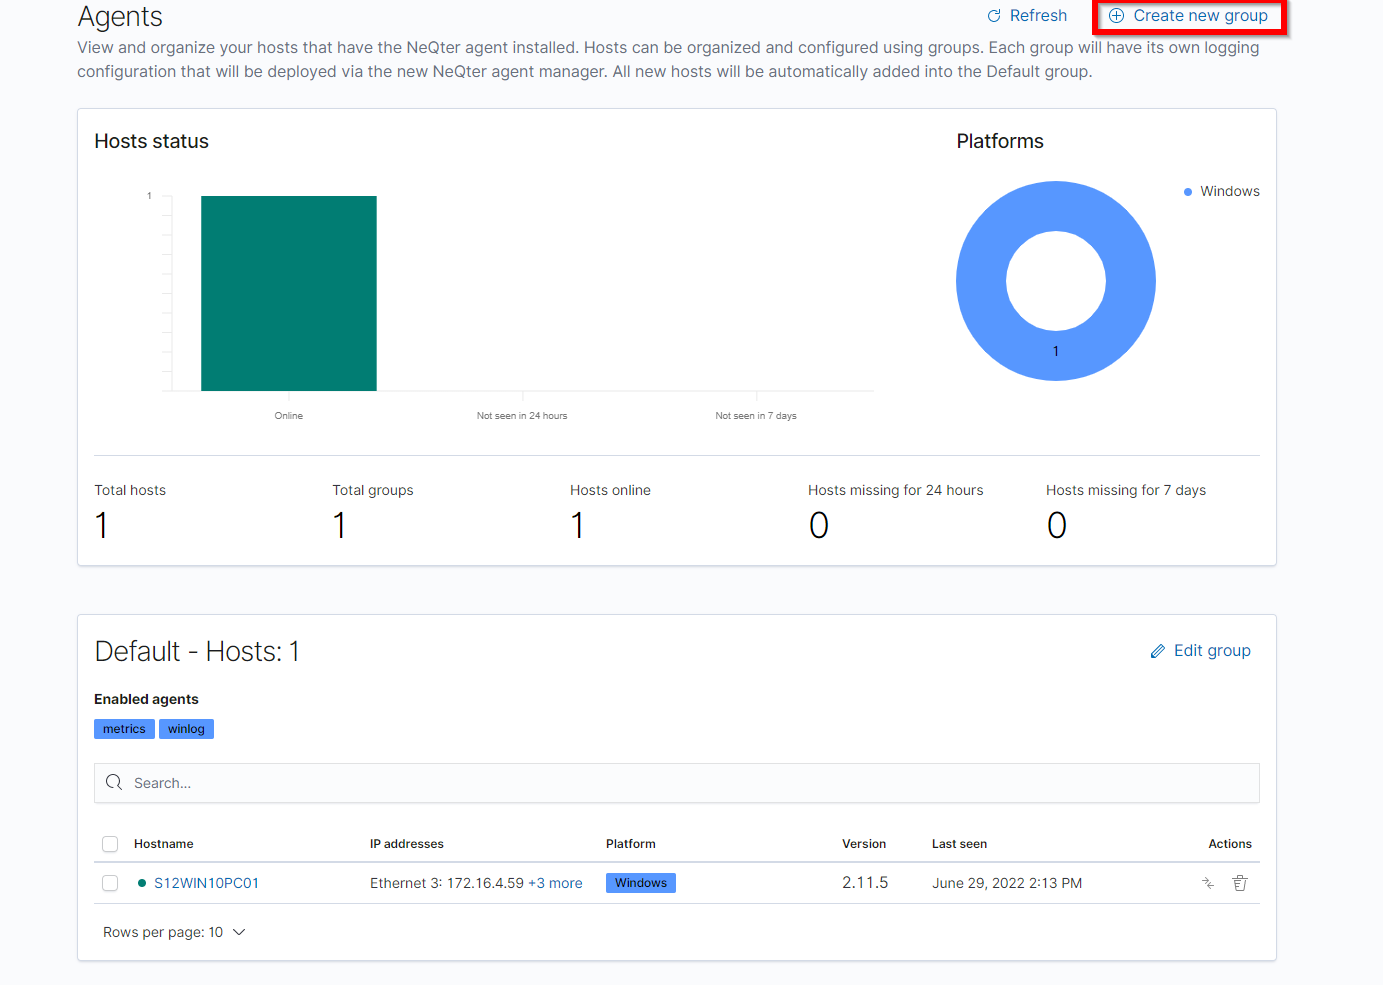
Outside of organizing hosts into different groups you can also use the group feature to assign separate groups of hosts different configurations for their agent managers. To create a new group you will need to click on the Create new group button on the top right of the Agents page.
When clicked a window will appear saying Edit New Group group and it is from this window you are able to edit the group name as well as give a description for the group.
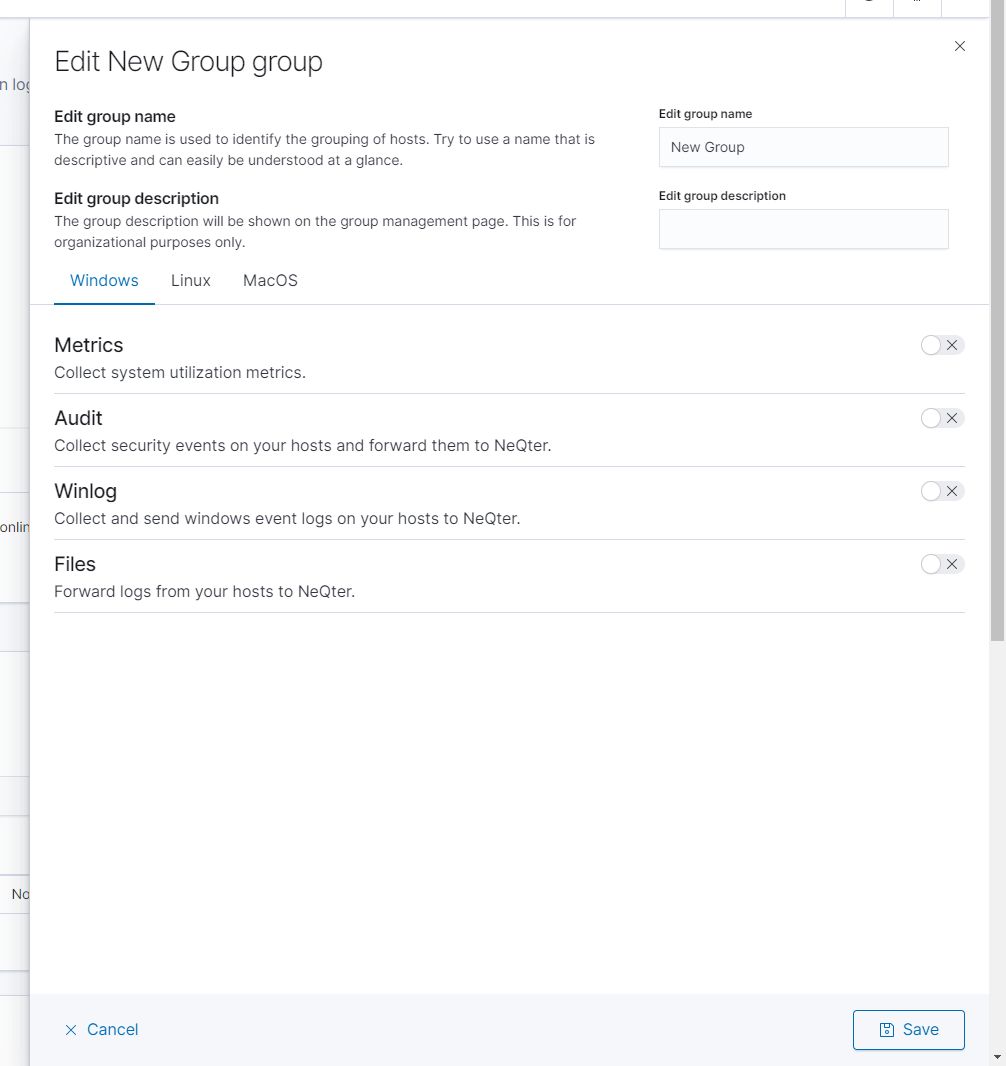
It is also under this window that you can select what type of information outside of host inventory data you’d like to collect. This includes Metrics, Audits, Files and Winlog for Windows Agents and Metrics, Audit and Files for MacOS & Linux. Each of these perform different kind of tasks and go as the following:
Metrics:
Used to keep track of hardware utilization such as ram, cpu, gpu and disk space usage. Will also use this information to produce averages for each of these such as average ram utilization or average read / writes per minute and so on. To have this service enabled click on the Switch to the side of metrics.
Audit:
Used to audit a specific file path, will monitor all files under said filepath for changes such as modifications, deletions and creations. This agent is used more on systems without an inherent method to do such processes such as many linux based systems.
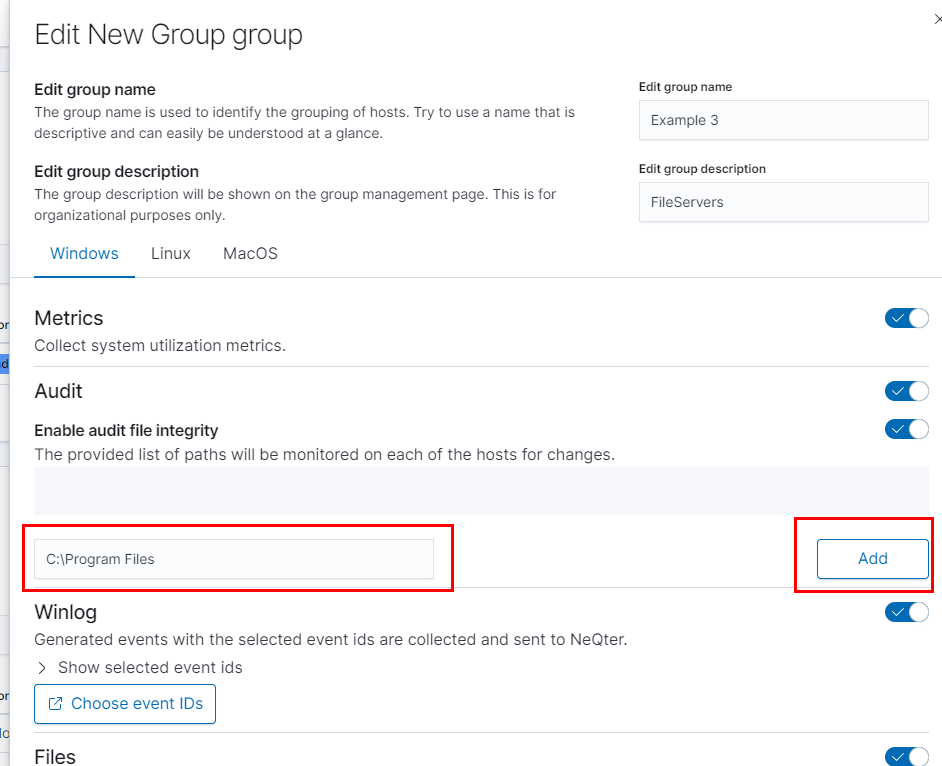
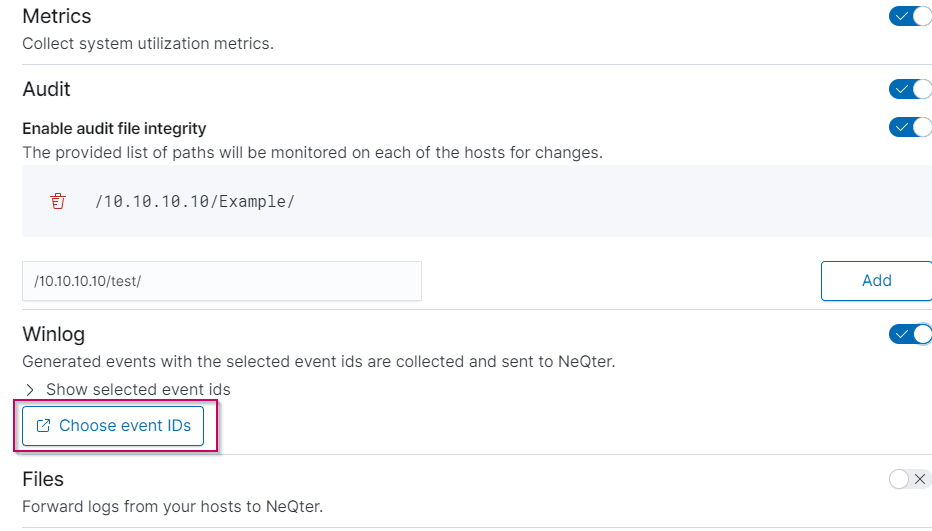
To set up the audit tool, you will first need to enable auditing and the File Integrity tool. Then insert the file path you would like monitored and click Add. You can also add multiple paths allowing you monitor multiple sections of your device.
NOTE: For windows devices we suggest using the audit event logs already generated by windows. You can find our documentation on setting this up here.
Winlog:
When enabled the Winlog agent will start collecting event logs generated by the host device it is installed on (or if on a DC with Active Directory it can also start collecting some logs through AD). To start selecting which event IDs you want to collect click on the Choose event IDs button.
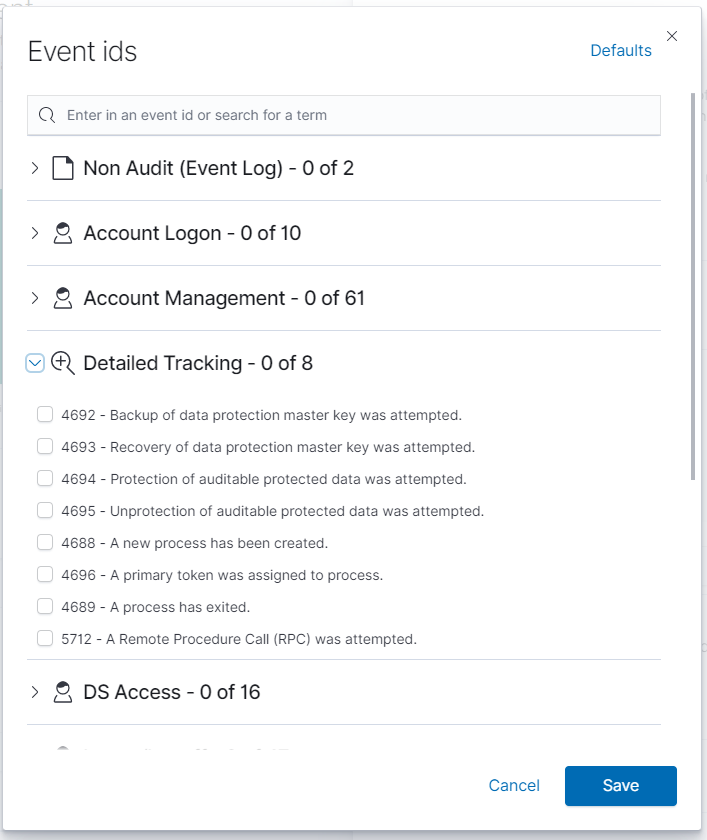
Once on the Event IDs window you will find a list of event ids. The list of event ids will be broken down into different categories for better organization, you can open each category to see the list of events under them and then from there select which ones you’d like being monitored. You can also search for events by putting in the event id on the search bar found on the top of the window.
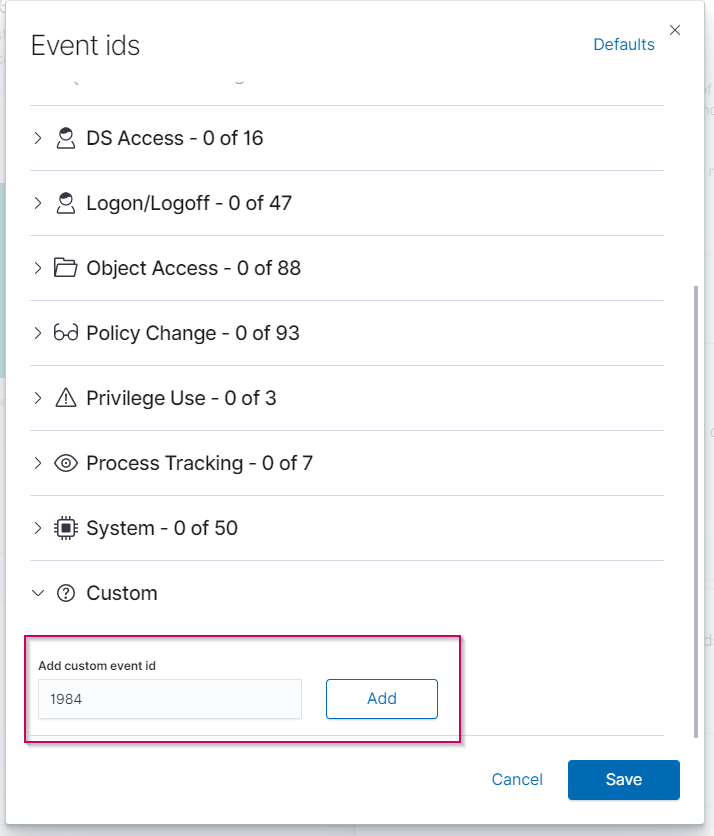
At the bottom of the Event IDs category list there is a category called Custom, under the custom category you are able to add in your own event id that might not be present on the event id list. To add an event id type in the event id number and then click on the Add button to add your own custom id.
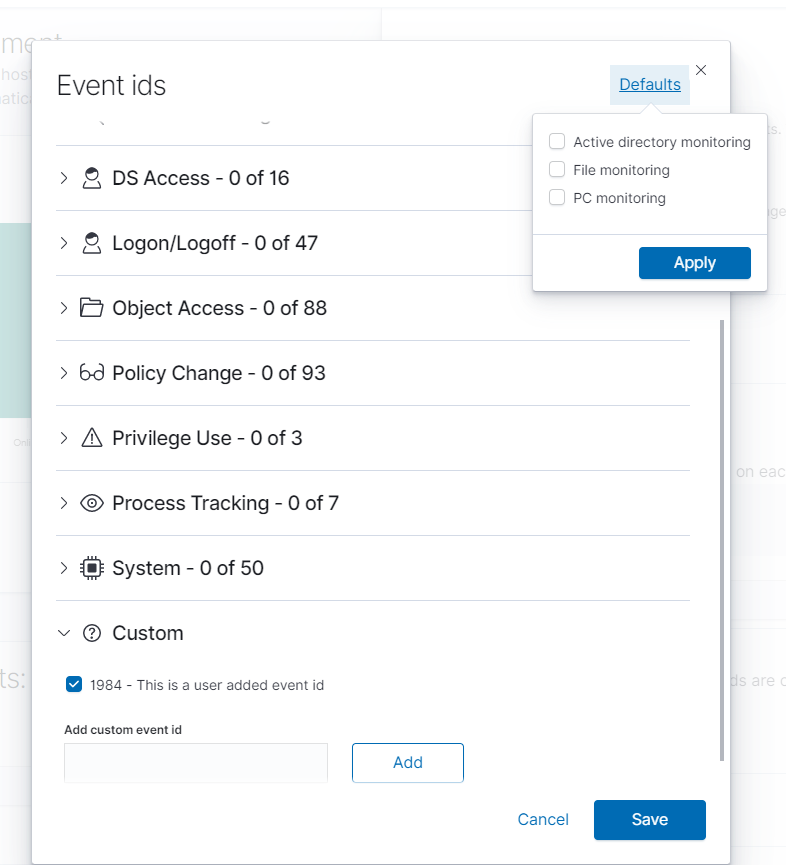
Lastly, NeQter provides a few presets that are useful for when you are trying to get a quick configuration setup. If you click the Defaults button on the top right of the window you will be presented with a small list of presets that you can choose to apply to your event id list. You can select any combination of the three presets and once done click Apply to apply the settings. For quick reference, each of these presets do the following:
Active Directory Monitoring is used to set up a very basic configuration used to monitor AD Logs.
File Monitoring is used to set up a basic configuration for grabbing logs pertaining to any audited files on your device
PC Monitoring is used to set up a basic config for grabbing local event logs.
Files:
The Files agent is used to ingest logs that might be collected on the local device. For example if you have a network device sending remote logs to a file share you can use the File agent to grab copies of those and send them to the neqter device as they update. To set up a file path see the Audit section from earlier in this page for more details.
Once your group is fully setup and ready to go you can click the Save button on the bottom right to finish. If you ever need to edit the settings of any particular group you can click on the Edit Group button found next to the group you’d like to edit. You can also delete groups by clicking Delete group button found next to each group as well (Excluding the default group).
Lastly all the information collected by the Metrics, Files, Audits and Winlog services can be found by navigating to the Discover page or Dashboards page. However, you will also need to make sure to also have their respective dashboards enabled on the Dashboard Settings page as well in order to view the data collected on those pages.
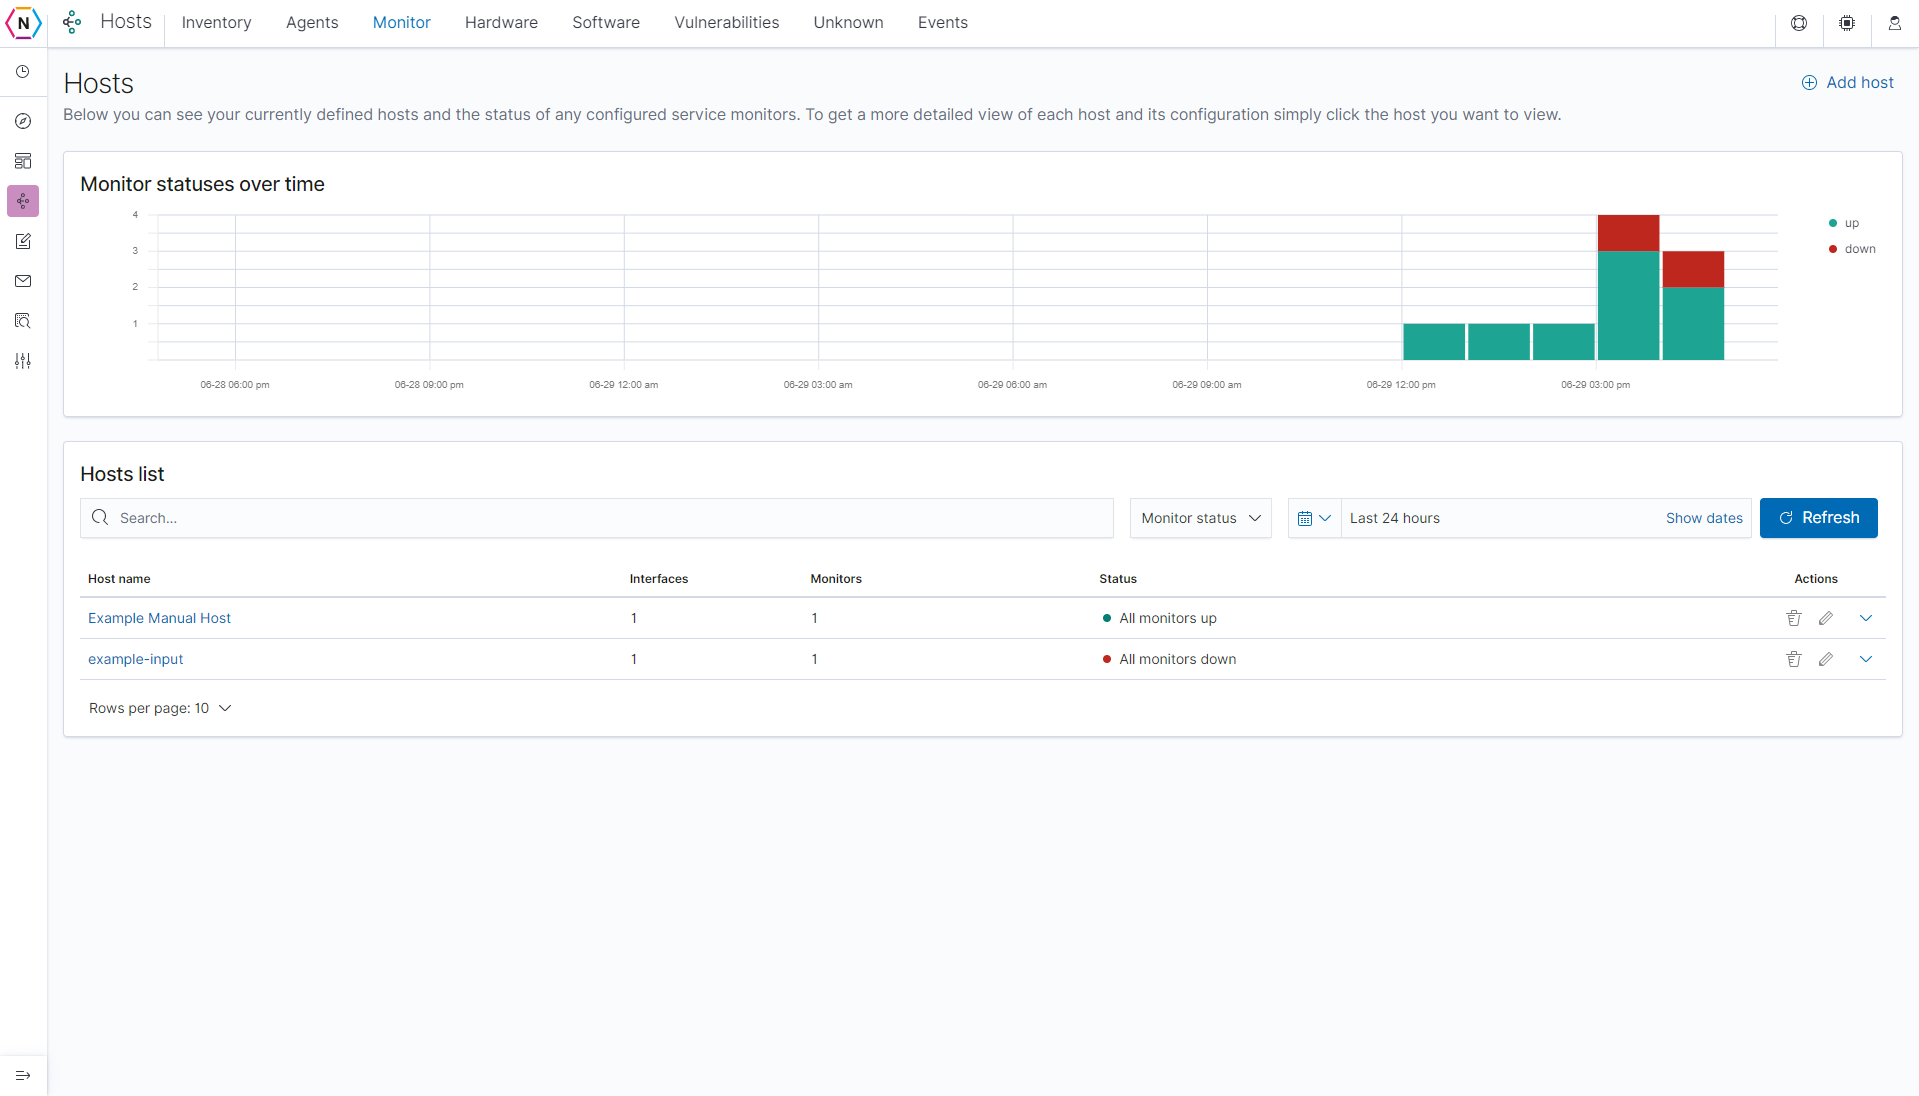
Monitor Tab
The Monitor tab keeps track of the status of interfaces and services that you currently have configured to be monitored. You can see a list of of hosts, the interfaces being monitored for each host as their status. you can also choose to delete, edit or create new host monitors on this page as well. If a monitor is created for a host that doesn’t already exist via Inputs, Agents or Vulnerability Scans then it will create a new entry under the Inventory tab as well.
Creating / Editing hosts
To add a new host, click the Add host button on the top right of the page. From there you will be brought to the following screen. Outside of the hostname all other information presented on this page can be ignored for the creation of a Monitor, however you can find more information about them under the Inventory section. The only two sections that will need to be filled for a monitor is the Host Network Interface and Service Monitor section.
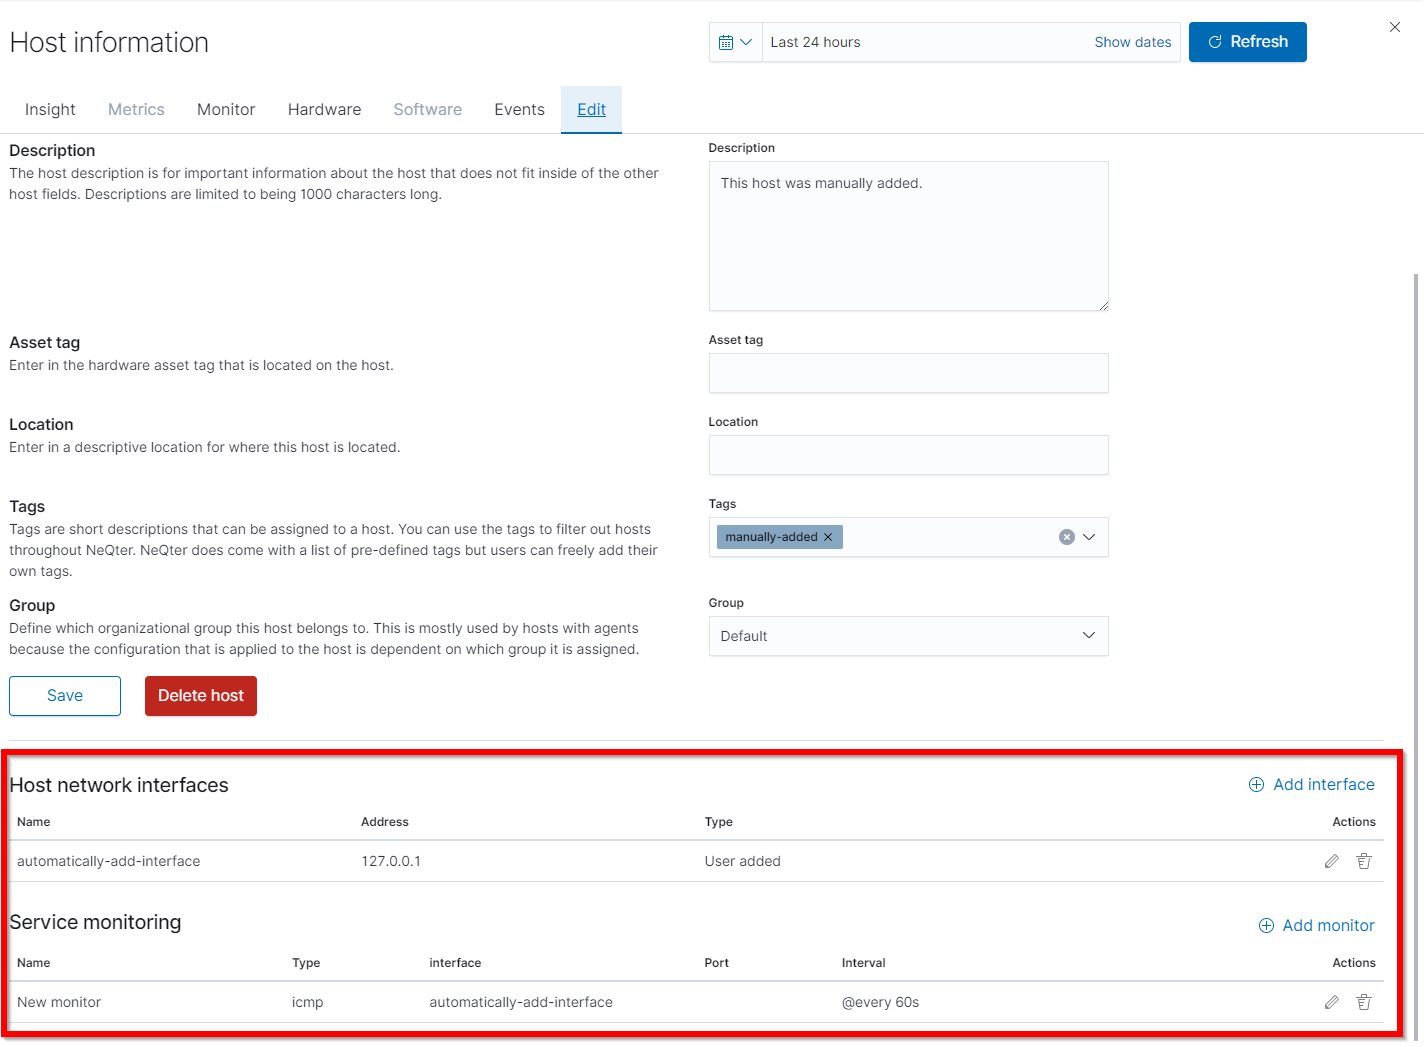
NOTE: By default, when creating a new host it will generate a interface and monitor automatically.
To create a network monitor under the host, you will first need to click the Add Interface button. On the window that follows put in the Interface Address and name you’d like to associate to the interface. The Interface Address can also use IPV6 or DNS for its addressing. Once you’re all set, click the Add interface to host button to complete.
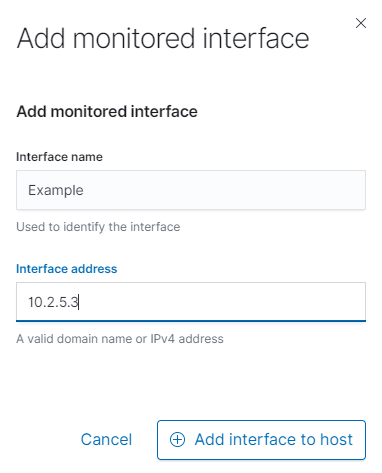
NOTE: For both Monitors and Interfaces you are not limited to having one Interface or Monitor per host. There is no limit to the amount of Interfaces & Monitors that can be found under a single Hostname
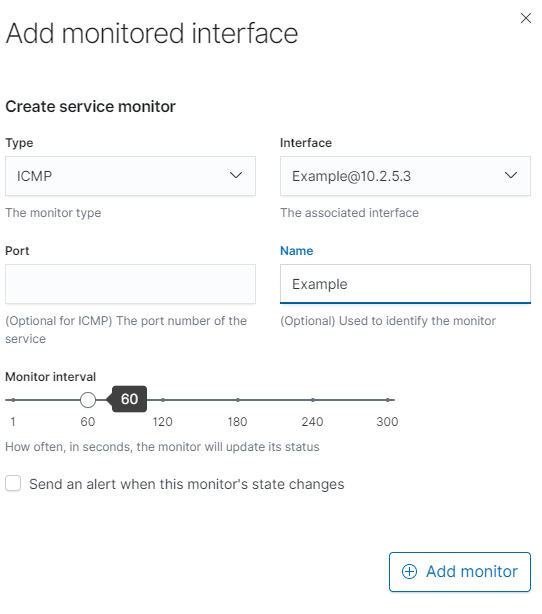
Next click the Add monitor button to create a new service monitor. Starting from the top you will need to first select the appropriate Type and the port needed to be monitored. If you have multiple interfaces on a host you will want to make sure that the correct one is selected. The polling period for each monitor is set to one minute by default, however you can adjust as needed using the bar shown in the picture below. You may also opt to be sent alerts if a specific monitor goes down by checking the box labeled Send an alert when this monitor goes into a down state?. When finished click the Add Monitor button to set up the monitor.
Once you have a monitor and interface connected and configured your host will now be able to start monitoring the port(s) you setup under the Service Monitor table. You are able to edit or remove interfaces and monitors by clicking on the edit and delete button respectively under the action column of their respective lists.
Monitor Host Info
Under Host Information > Monitor you are able to see monitor information for interfaces / service monitors that are covered by that particular host.
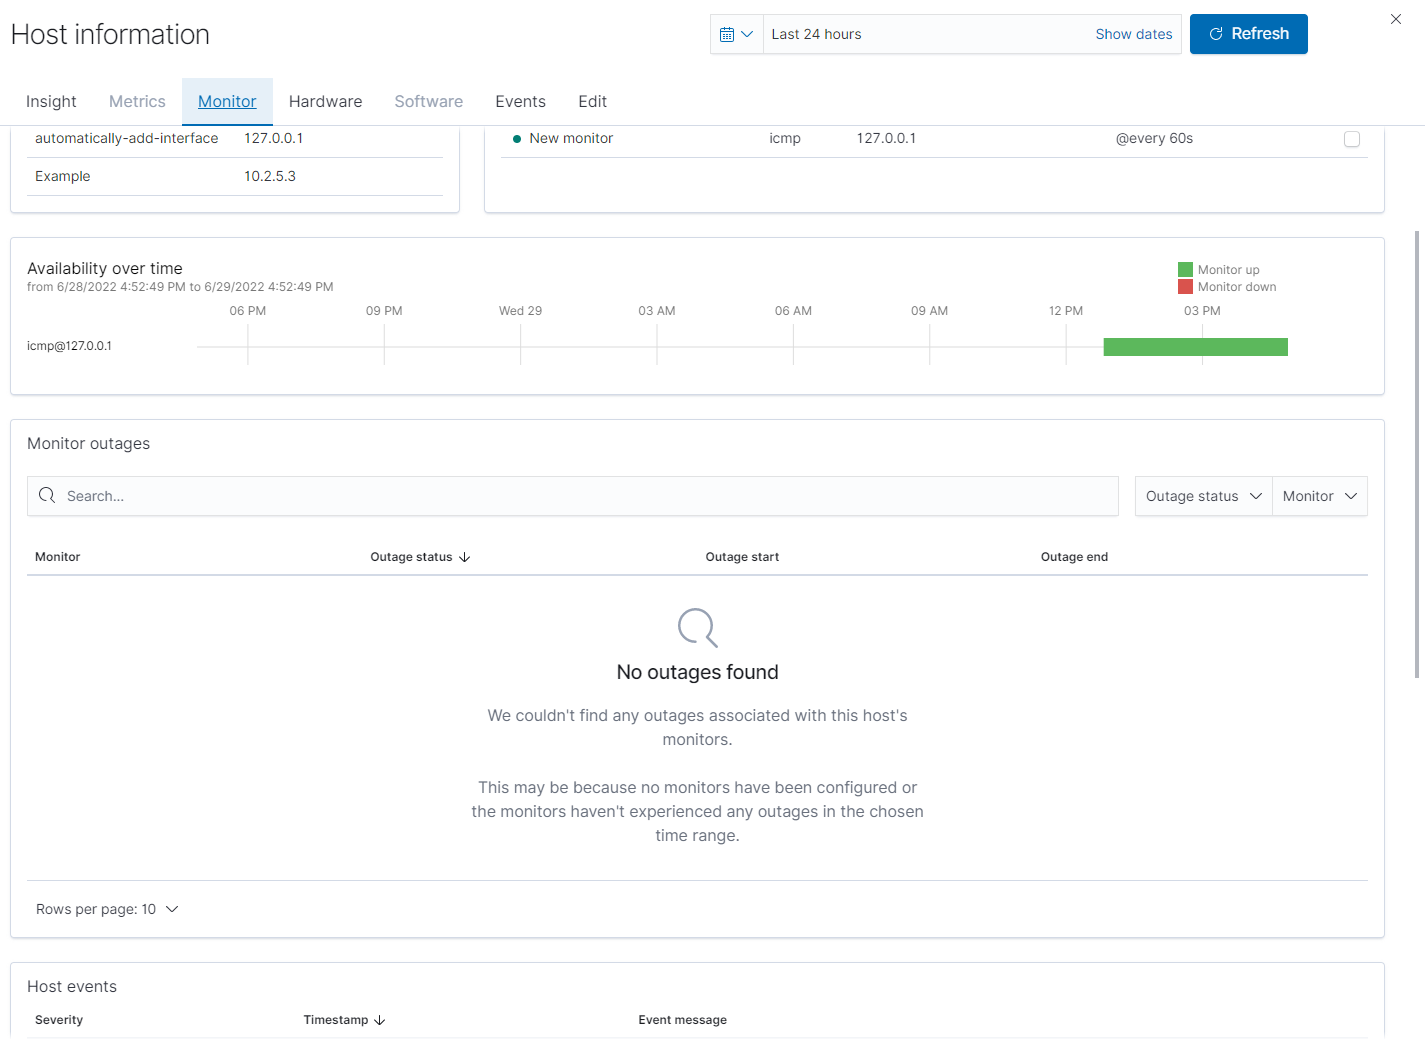
Information shown on this page include:
Availability over time: A timeline showing up and down time for the time range currently shown on the top right of the page. You can increase, decrease or change the scope of the timeline by changing the time range on the top right of the page as well.
Monitor Outages: A list of outages, including when the outage started, ended (if applicable) and a status section for if it is still ongoing or not.
Host Events: If alerts are enabled for the monitor this is a quick index showing all events generated by the monitor in question. To enable alerts you can go to the top of the page and click on the alert check box found next to each monitored address.
Average ICMP Monitor Return Time: Shows the average return time in Milliseconds between pings over a period of time.
Average TCP Monitor Return time: Same as ICMP Monitor Return Time but for TCP Pings instead.
Software & Hardware
The Software and hardware sections of the agent manager tool is where you are able to see what kind of software / hardware is being used across all devices with the agent manager installed on them. Starting with the Host Hardware page, you are able to see the type of hardware being used by all hosts with the neqter manager installed on them.
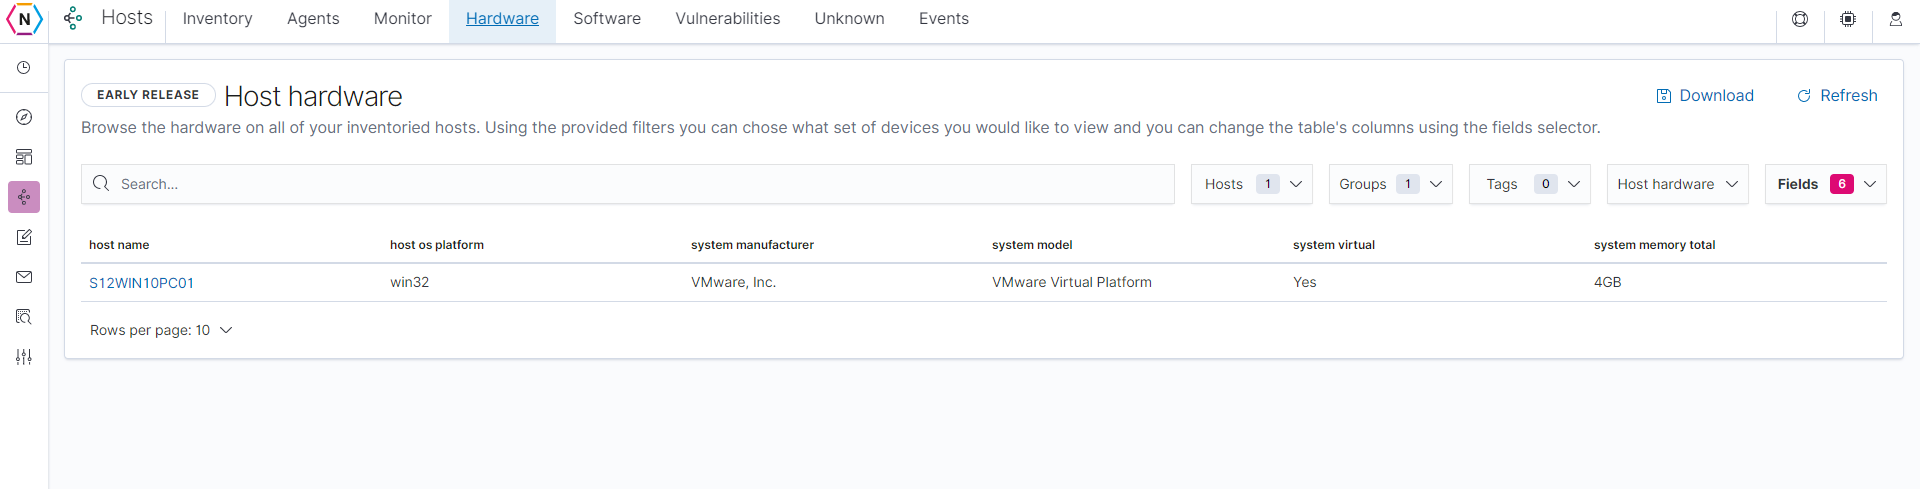
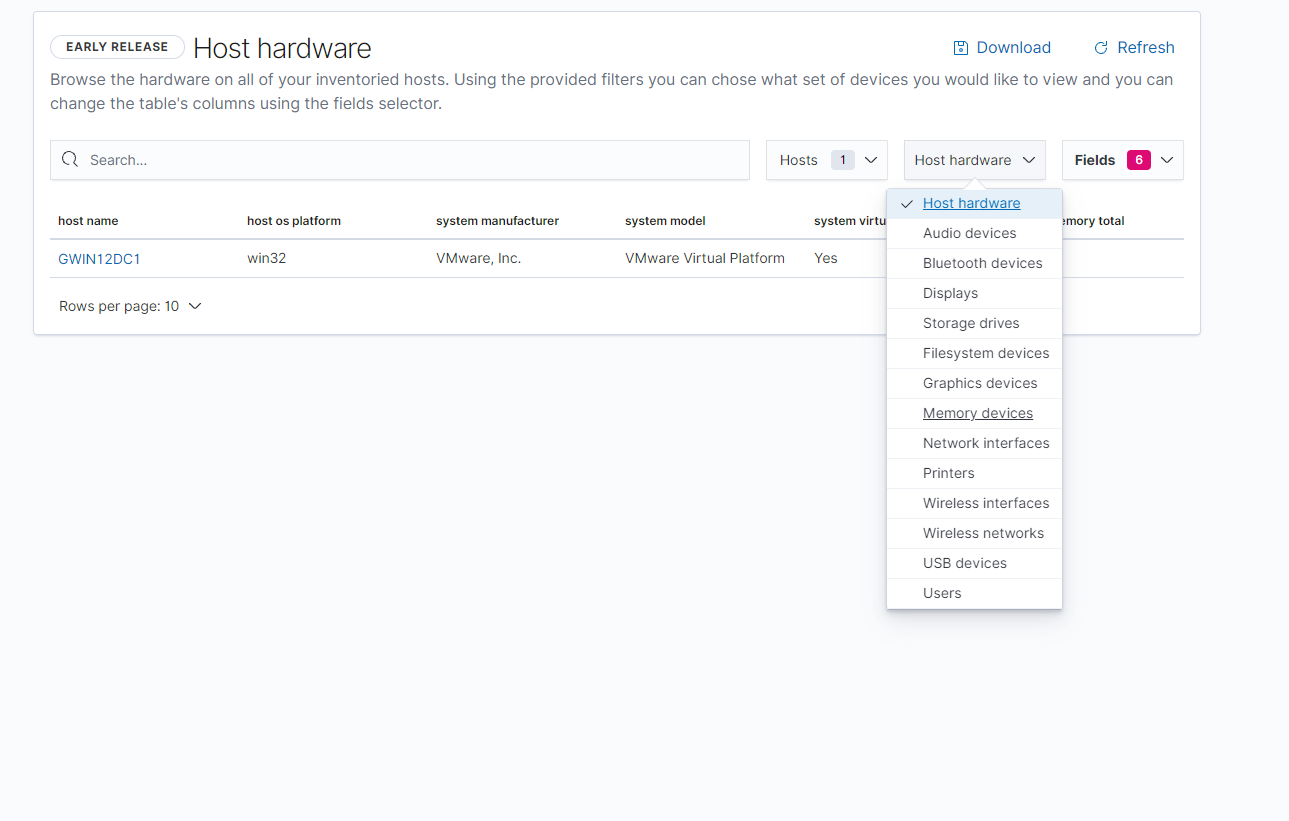
You can search for specific items by using the search bar on top as well as select what kind of hardware you’d like to see by clicking on the Host hardware drop down menu as shown below.
NOTE: Like the agent page you are also able to click on the ‘Host name’ to find out more information about any particular host shown.
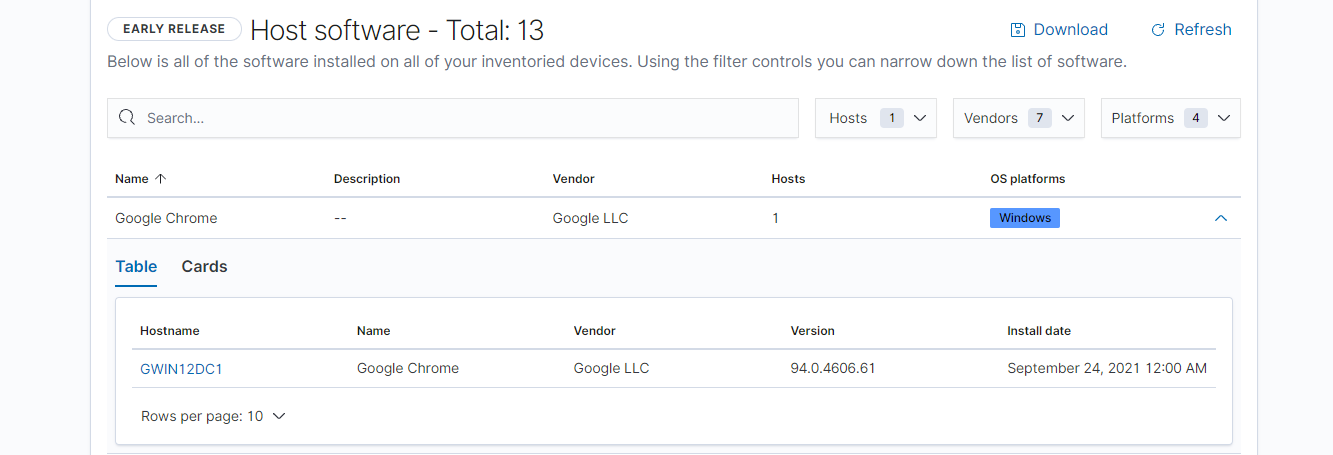
Next you have the Host Software page which is where a collection of all software found via the neqter agent manager can be found. Similar to the Host Hardware page you are able to use the search bar on top to search. You can also use the drop downs on the top right of the page to filter for specific hosts, vendors or platforms (Operating Systems).
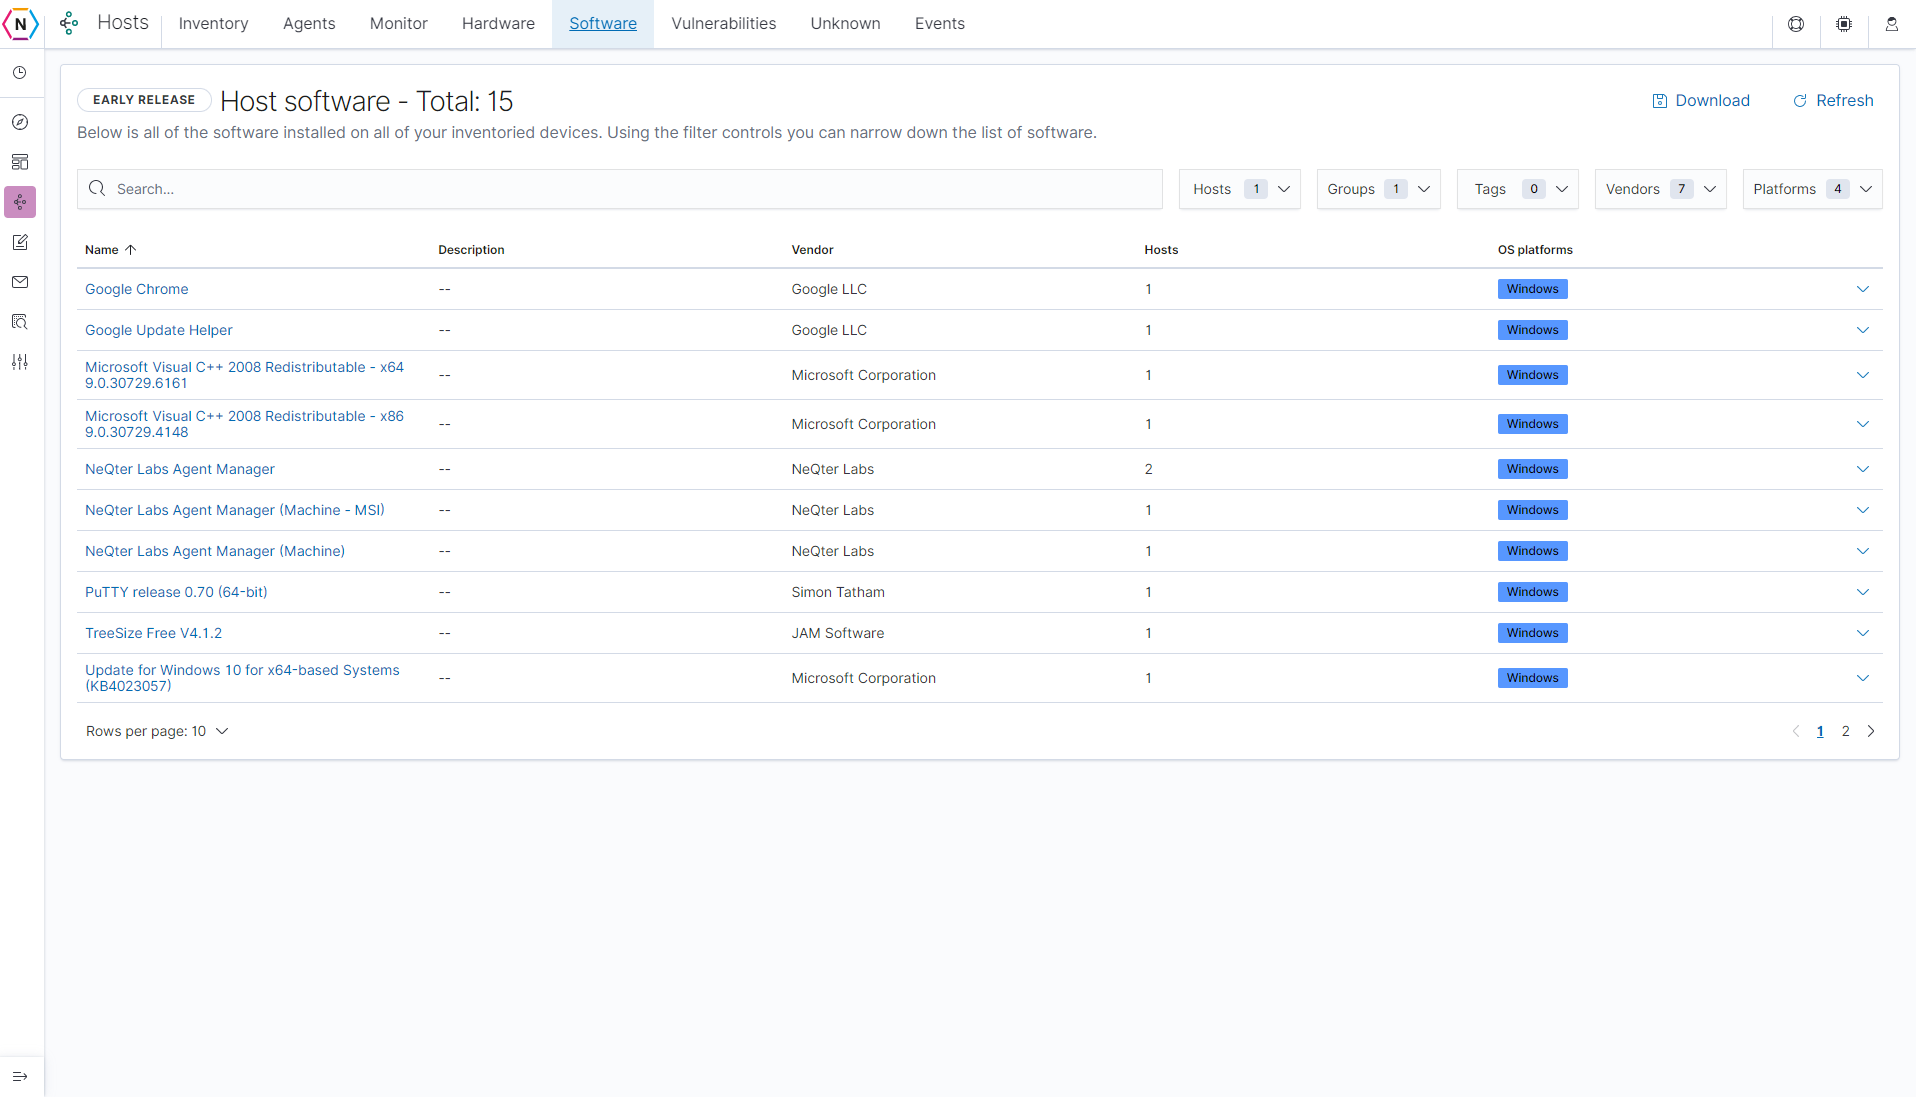
The list of all the software is broken down by column, starting from the left we have:
Name: Software name.
Description: The software’s description (usually very similar to name).
Vendor: The vendor of the software.
Hosts: How many hosts have this software on their device.
OS Platform: What operating system is this software detected on.
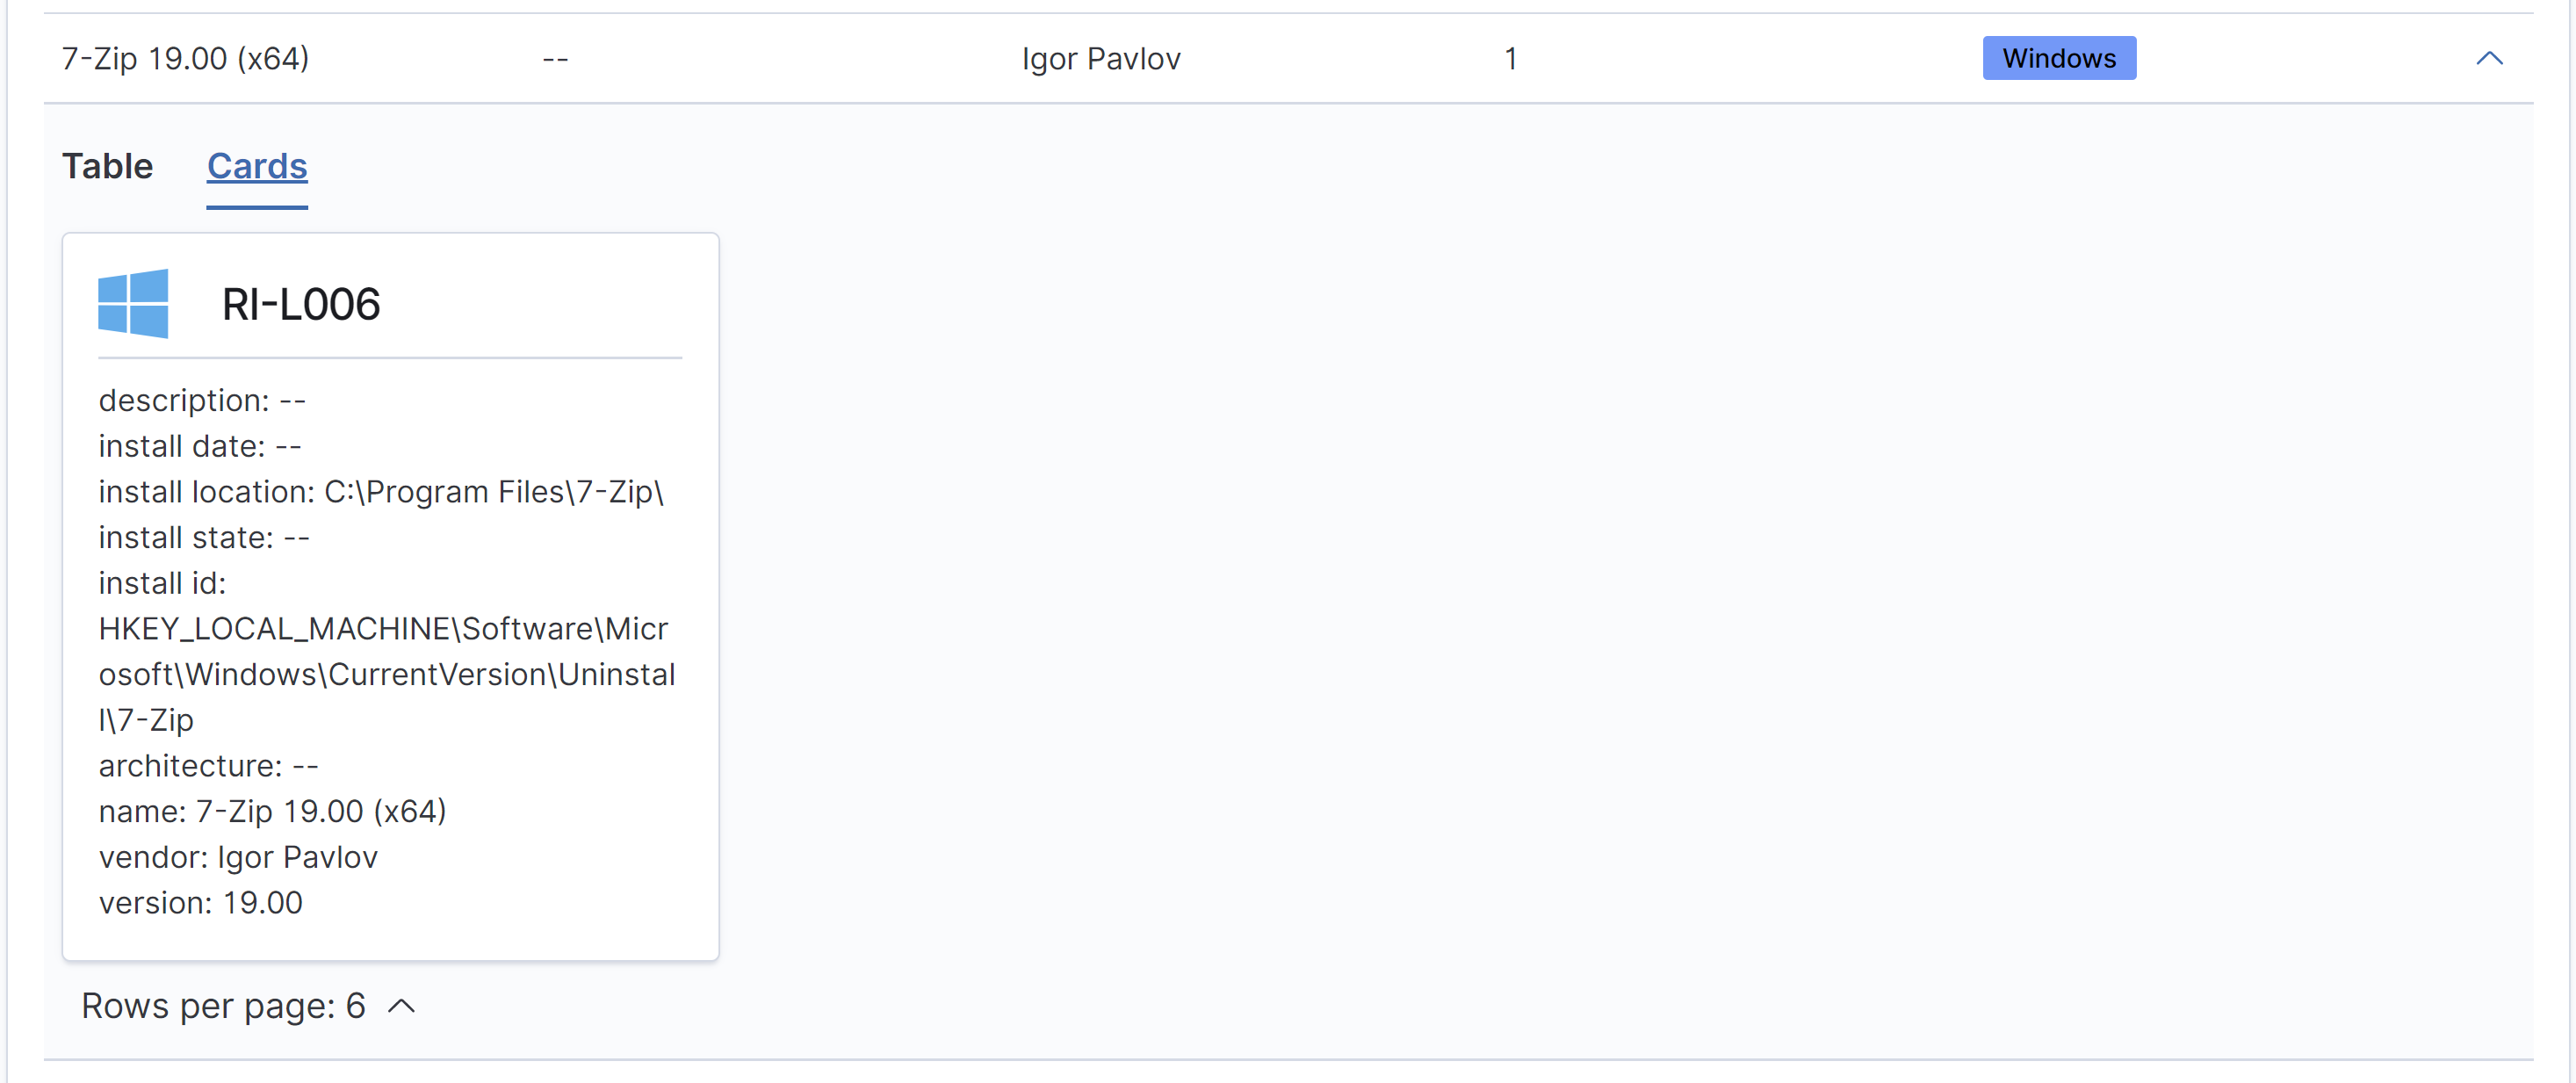
You can also select specific software to see a list of hosts of where the software is installed on. The list is broken down into either Table or Cards. With the Table format you are able to see a list of all devices with basic information about each one while with the card format you are only able to see upwards of 6 devices at a time but in much more detail as shown below.
Table:
Cards:
Vulnerabilities & Unknown
The Vulnerabilities tab contains information collected by vulnerability scans ran on your neqter core. It contains much of the same information found under the Vulnerability Scanner Tool’s own reports / result pages with the added bonus of being able to click on ips / device names to see local inventory information of that device.
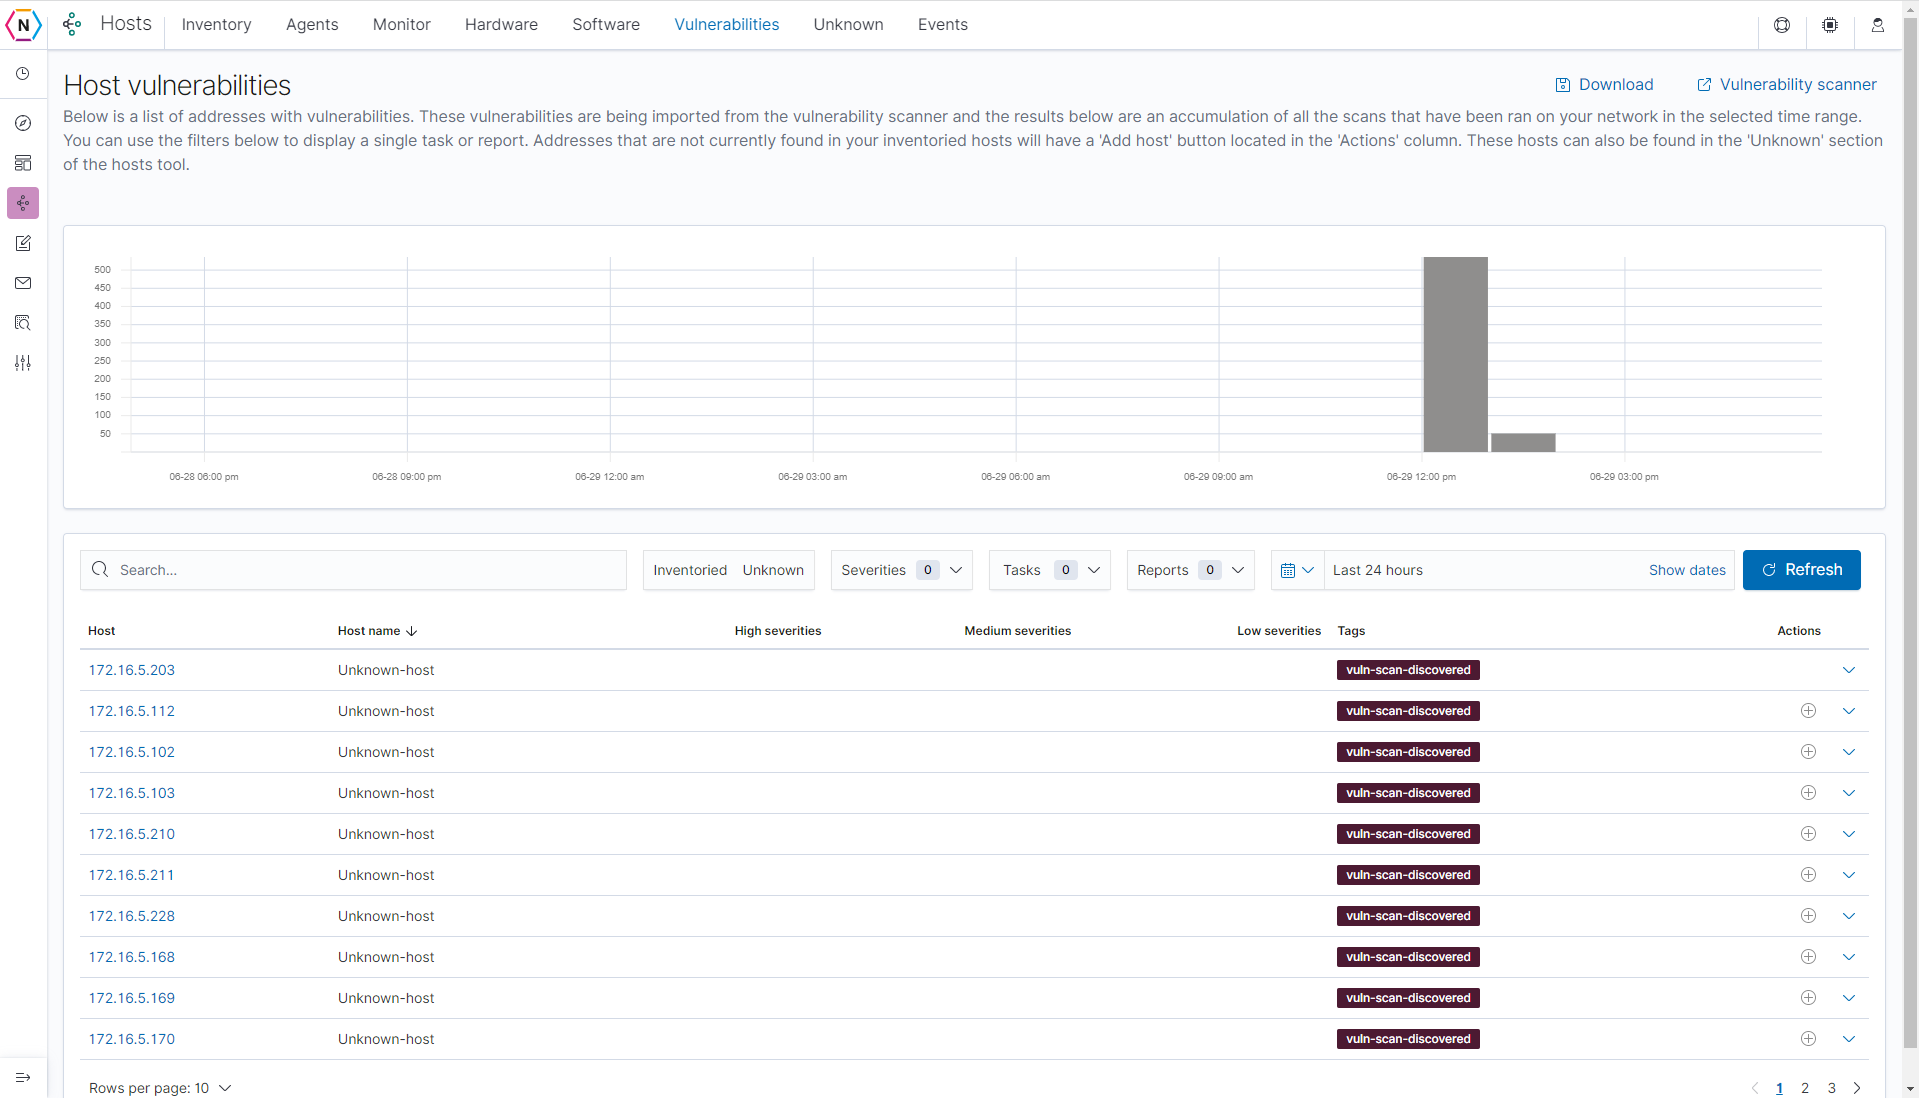
This feature allows you to go between vulnerabilities discovered and potentially a device’s hardware / software data, traffic logs, monitors and so on all in one place. For devices not already apart of your Inventory you can add them to your inventory by clicking the Plus icon next to each host under the Action column.
NOTE: If the icon is missing, that means it has already been inventoried.
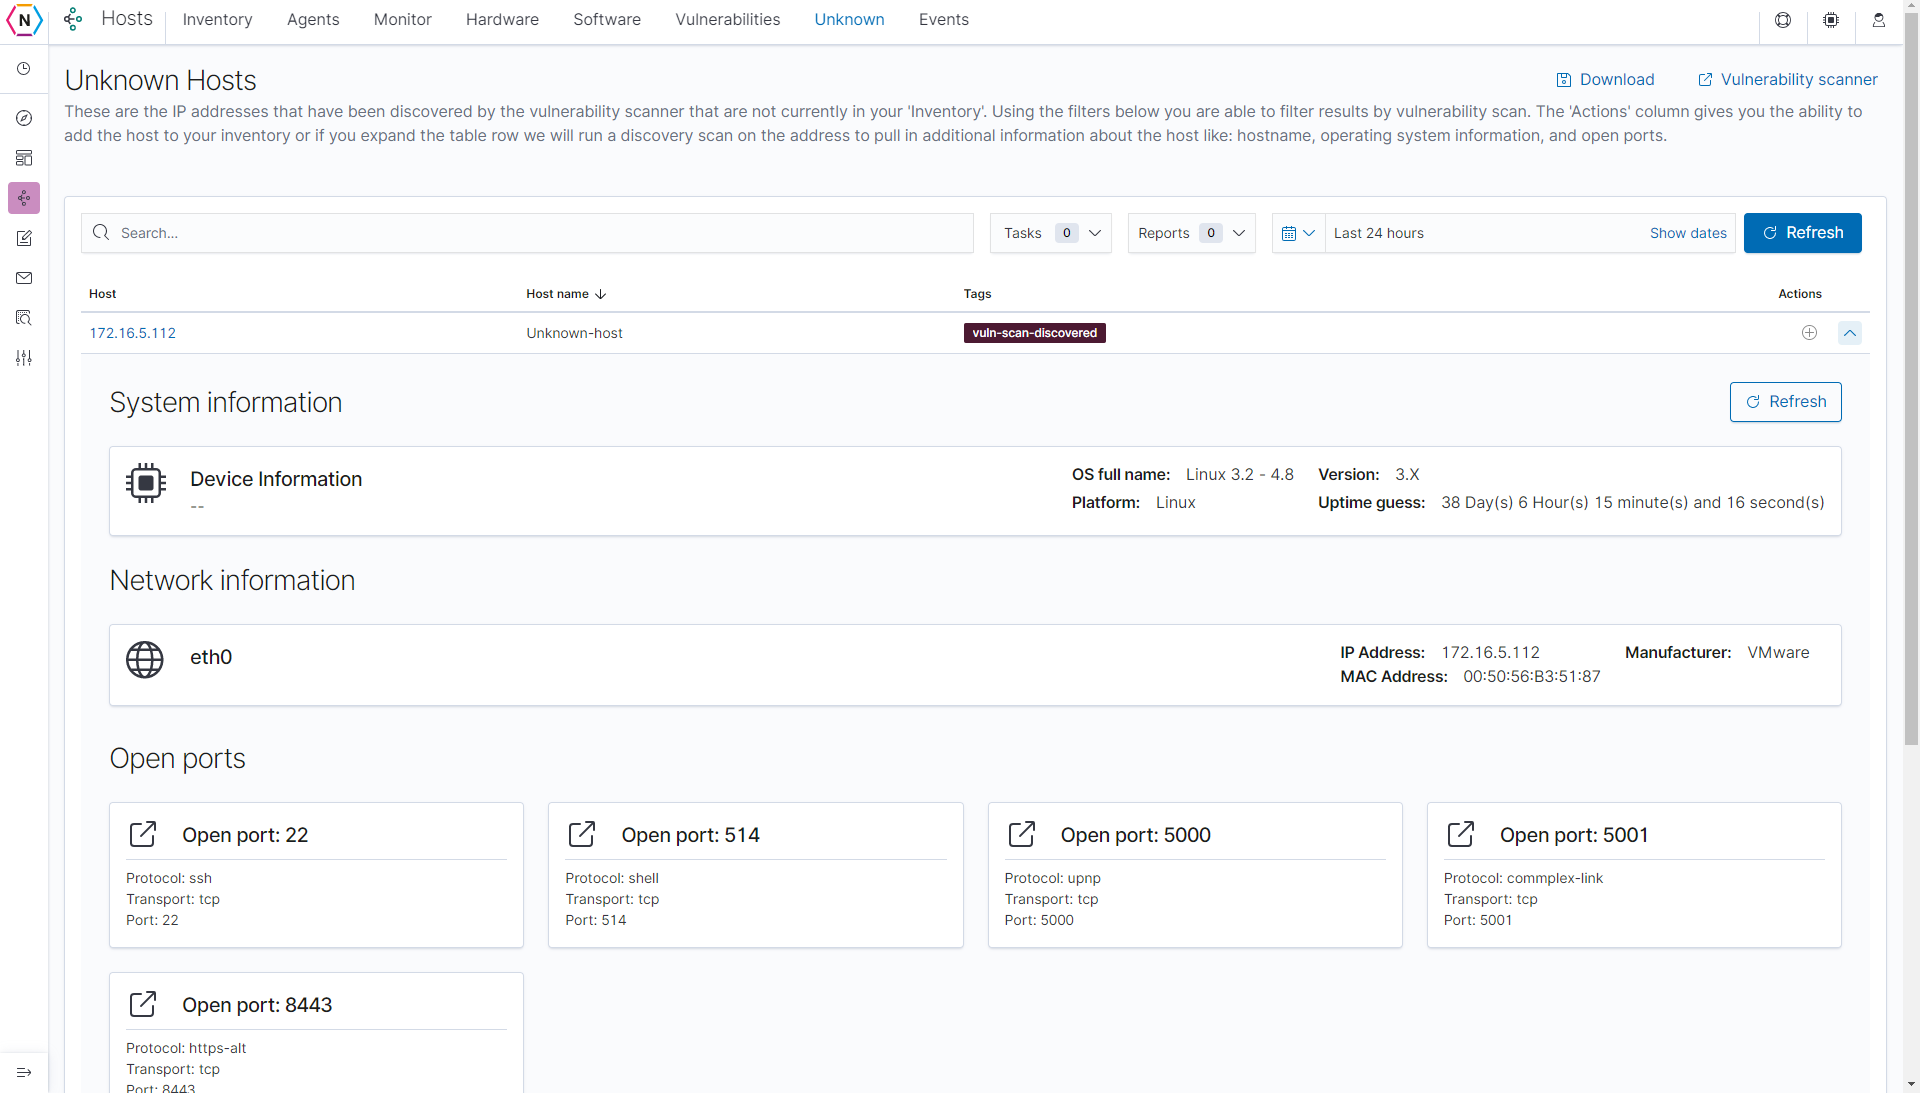
On top of the Vulnerabilities tab there is also the Unknown tab which contains a list of un-inventoried devices. You are able to run Nmap scans to discover host information on this page by clicking the down arrow found next to each host.
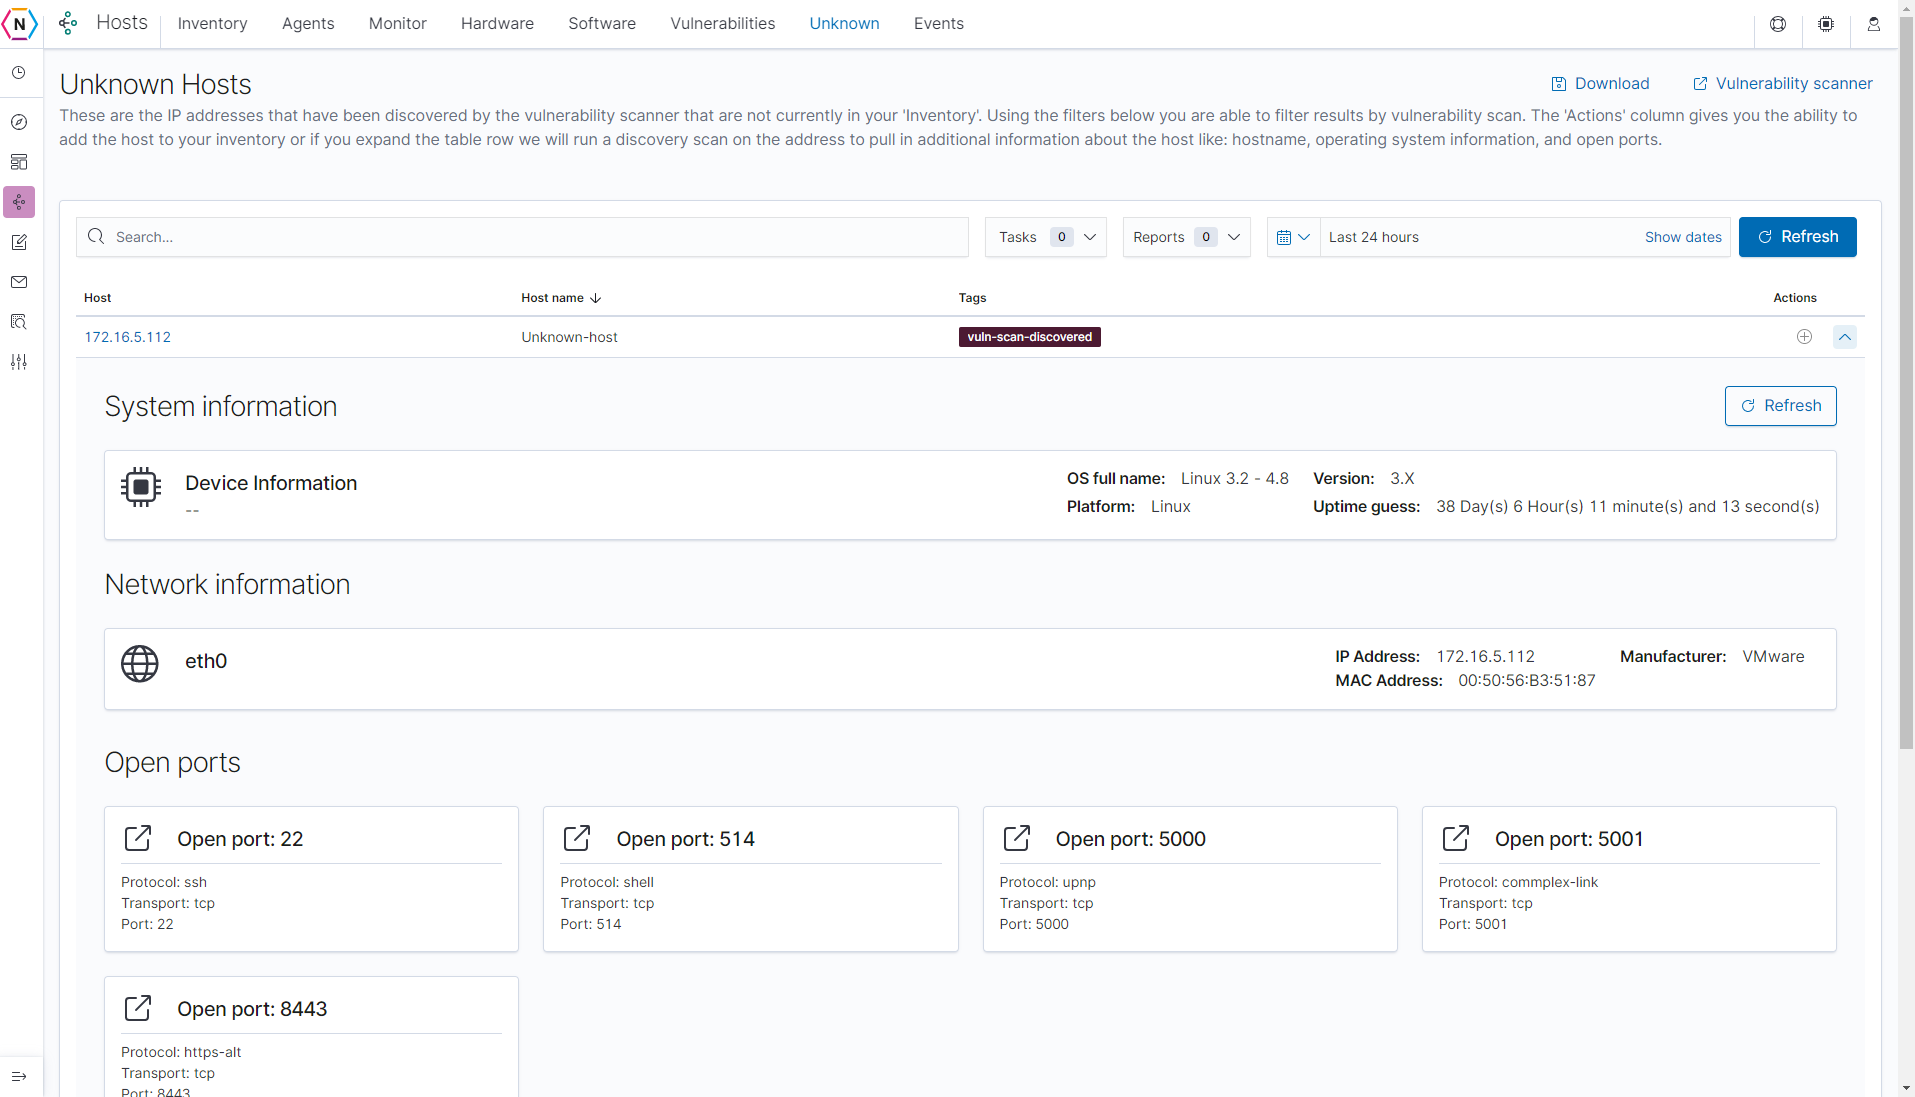
You can also add hosts found on this page to your via the same Plus icon found on each Host.
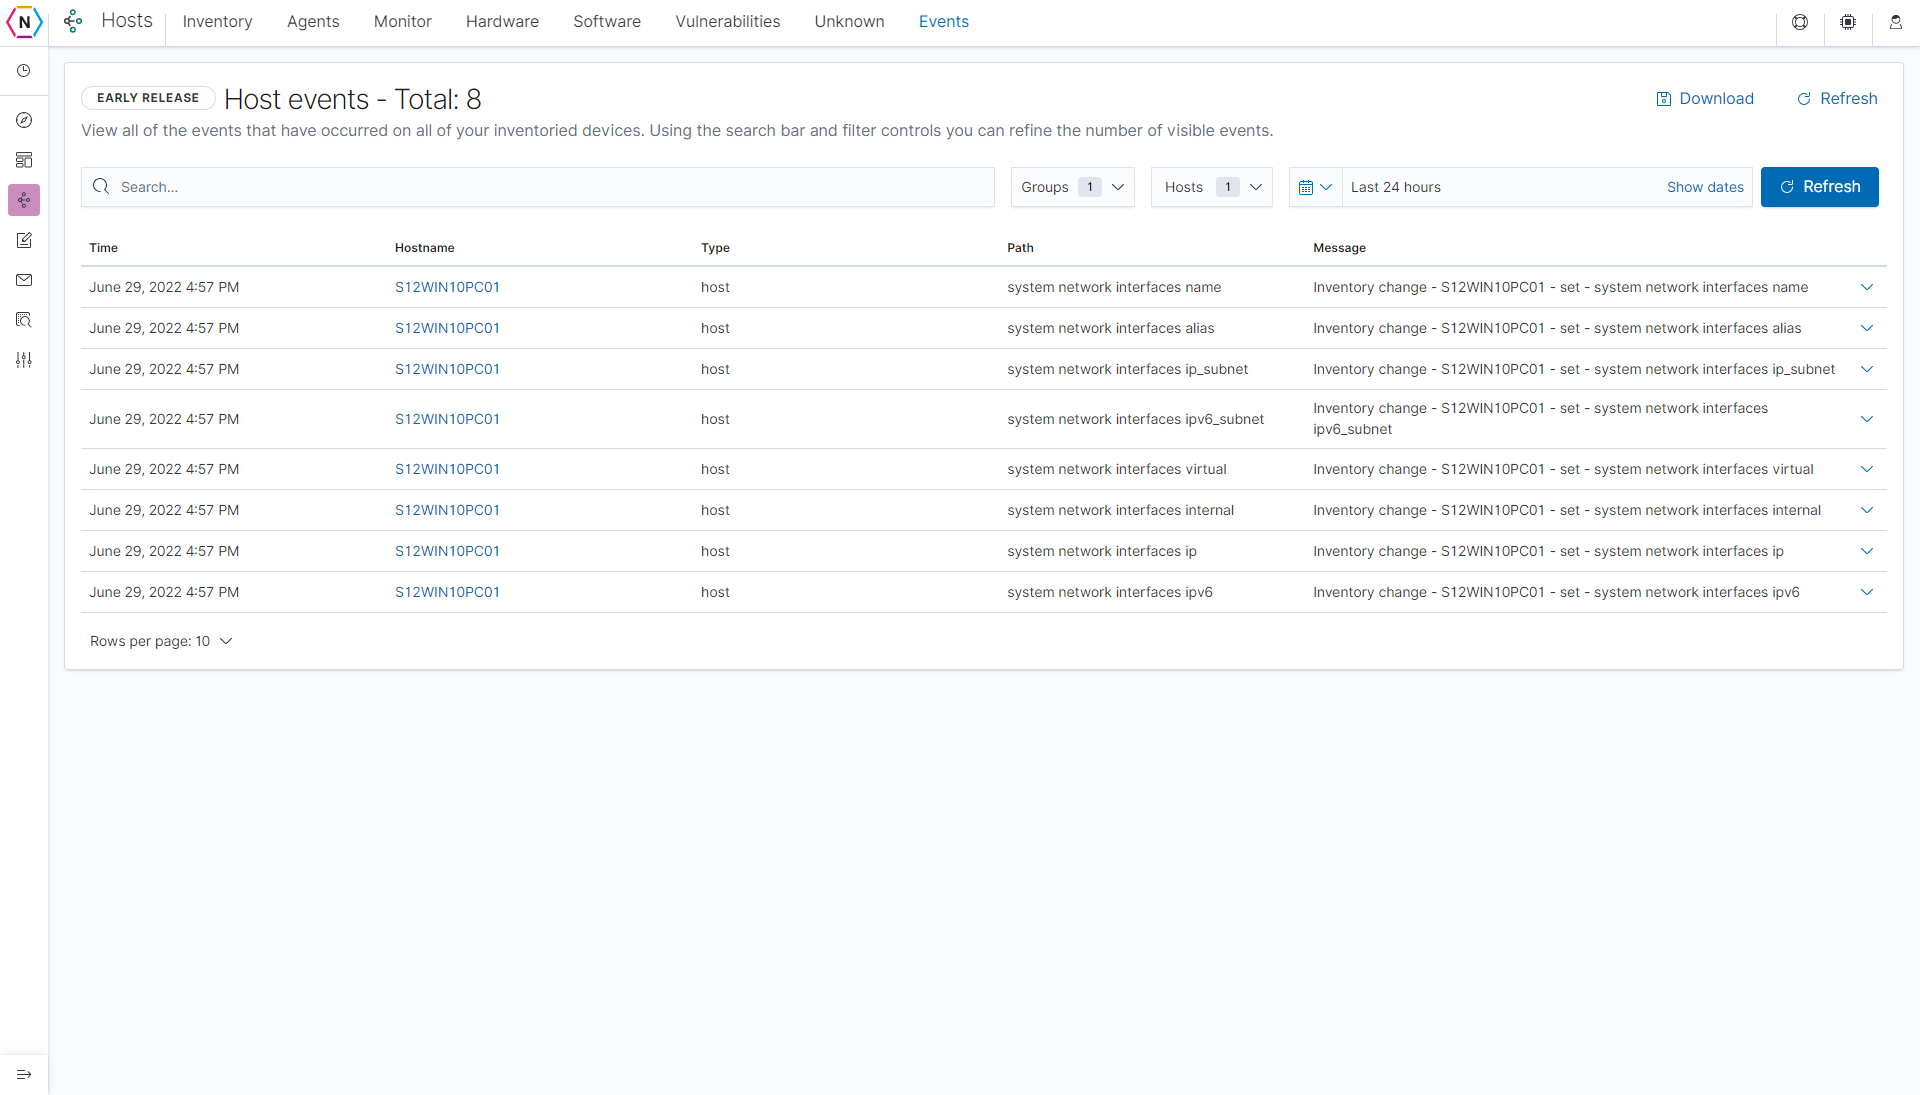
Events
The Events tab is where you can see hosts and Events related to them. Events are generated via a built in tool found on our the Agent Manager Software which means any devices without an Agent Manager will not generate any events. Types of events that are collected include hardware changes, software changes, audited file deletions and so on.
Inventory Report / Export Feature
Users are able to download the information collected on each tab under Hosts by clicking the Download button on the top right of each page excluding the Agents and Monitor page.
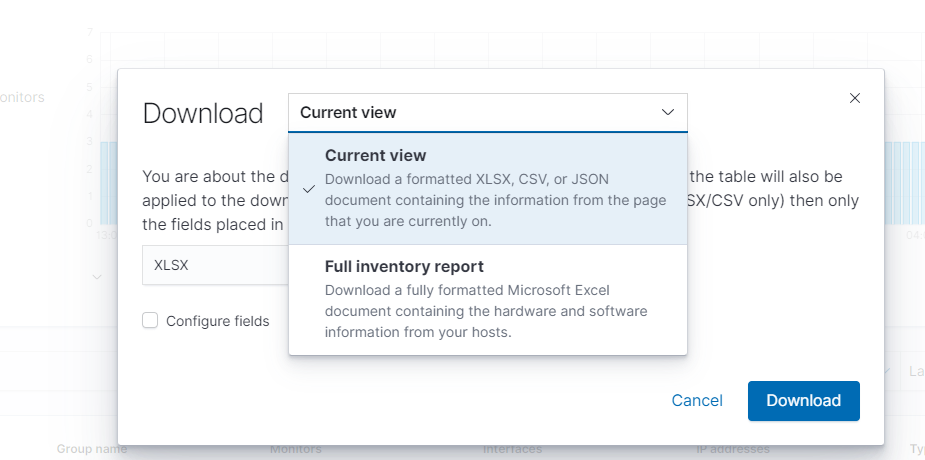
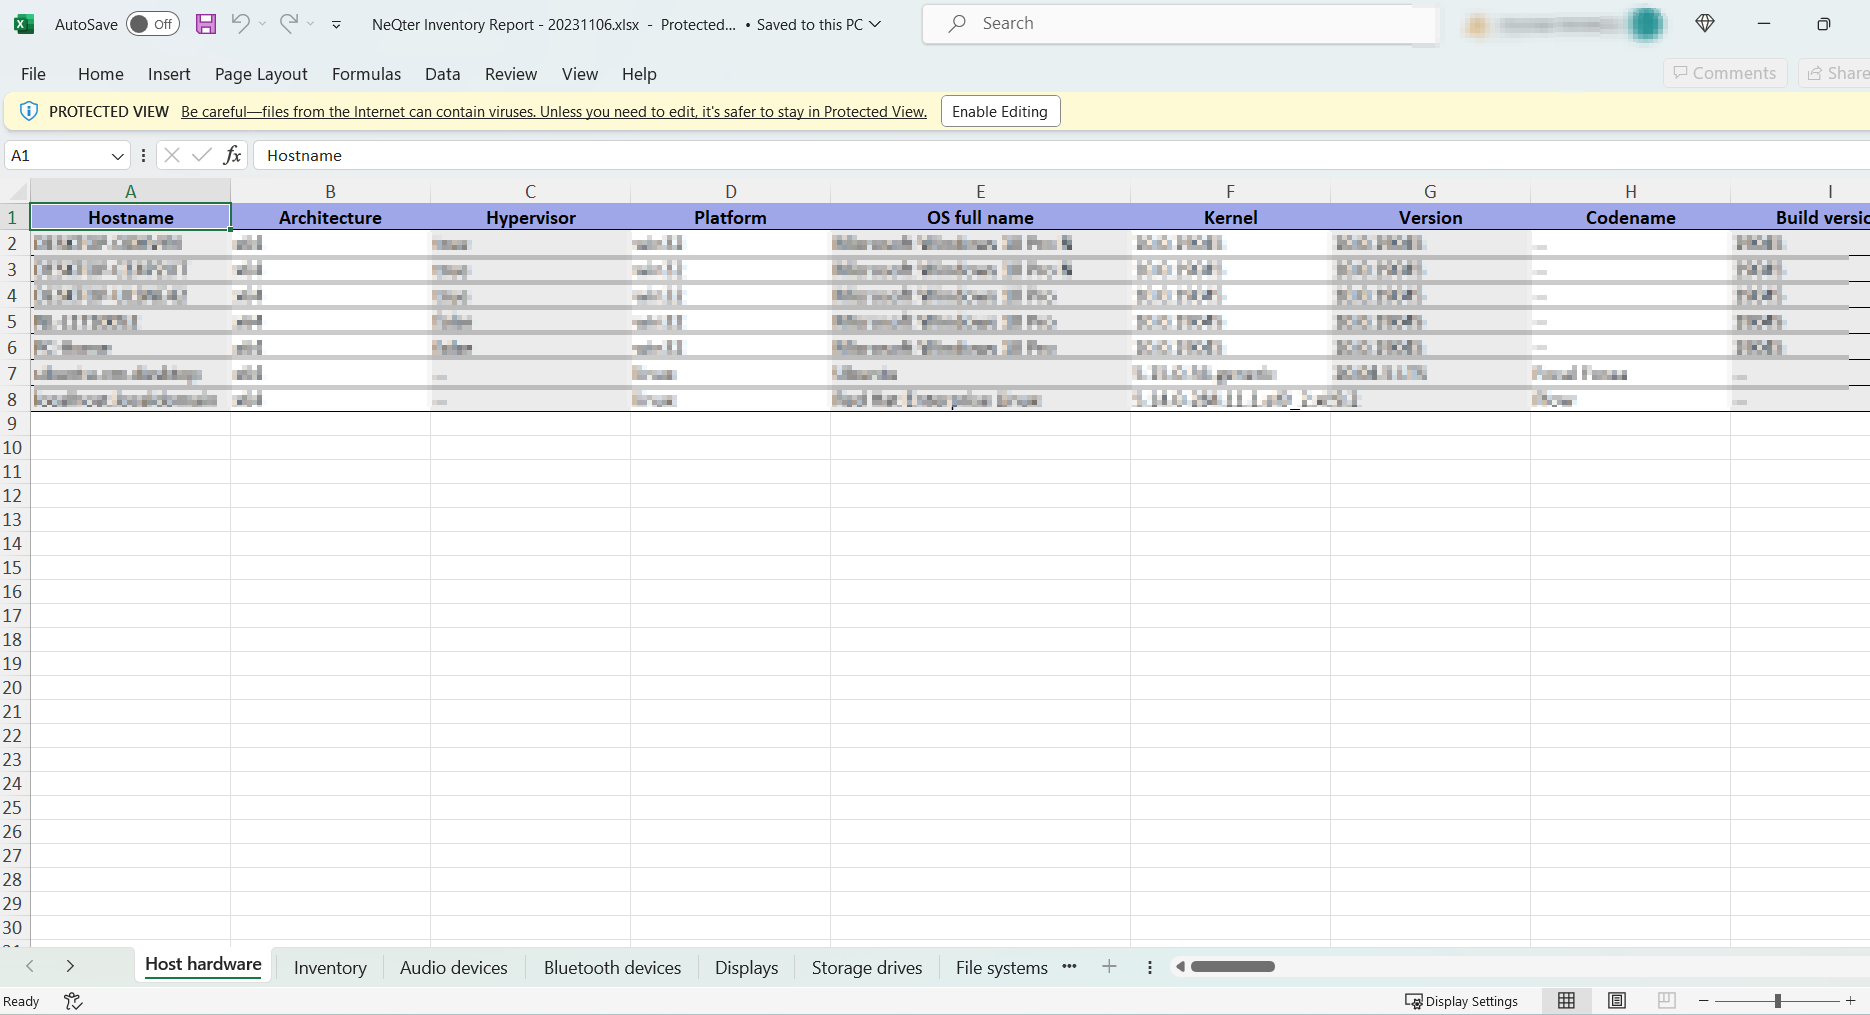
From here users are able to export either all information collected via the inventory system or only information found under the current view (This would be the page currently visible, such as Inventory, Software, Hardware, etc). The list can be exported as either a XLSX, CSV or JSON format file. Clicking the Configure fields button allows users to narrow down exactly what information they want sent for each host.
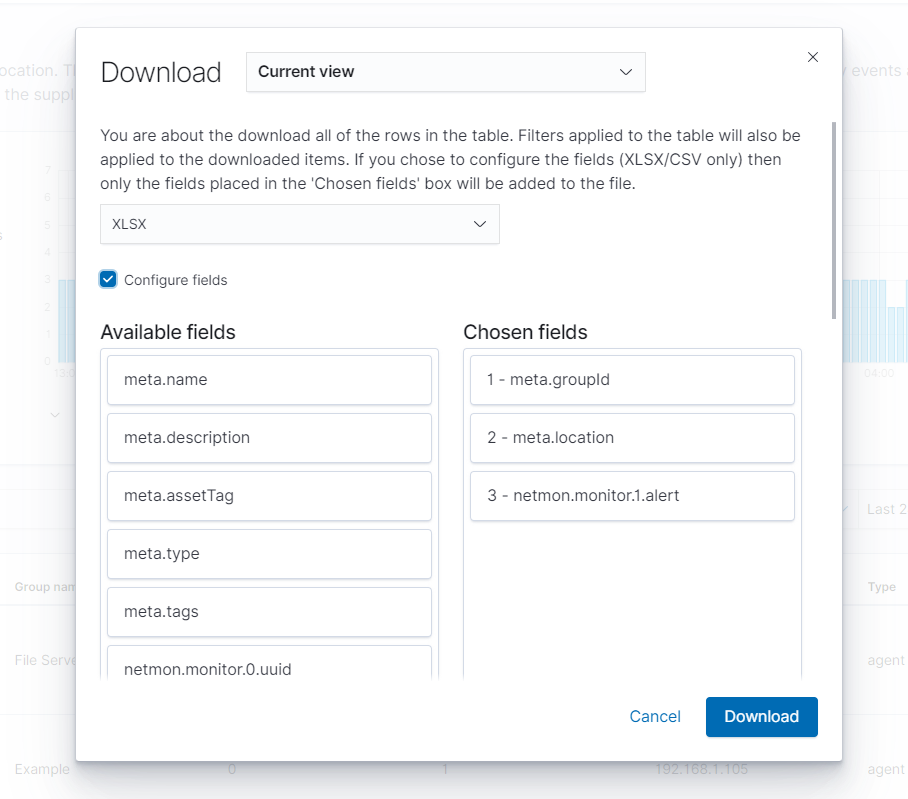
Once configured to the users liking they can download by clicking the Download button on the bottom right which will download the file to the local device. Below is an example of a Full Inventory Report and how it looks when opened in MS Excel.