NeQter Labs User Manual
Table of Contents
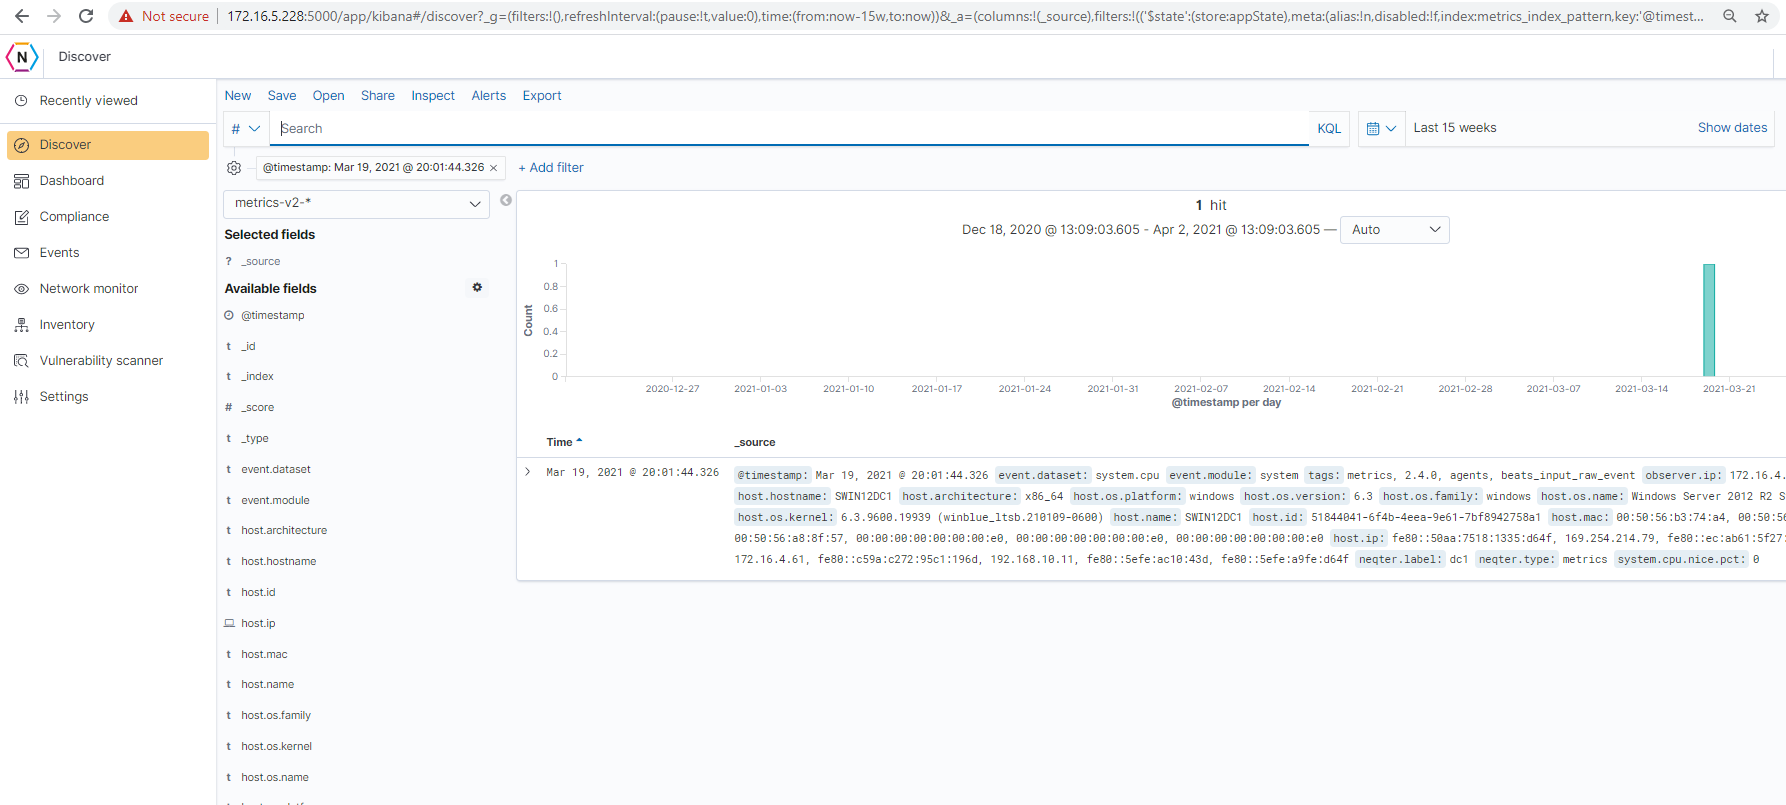
Discover
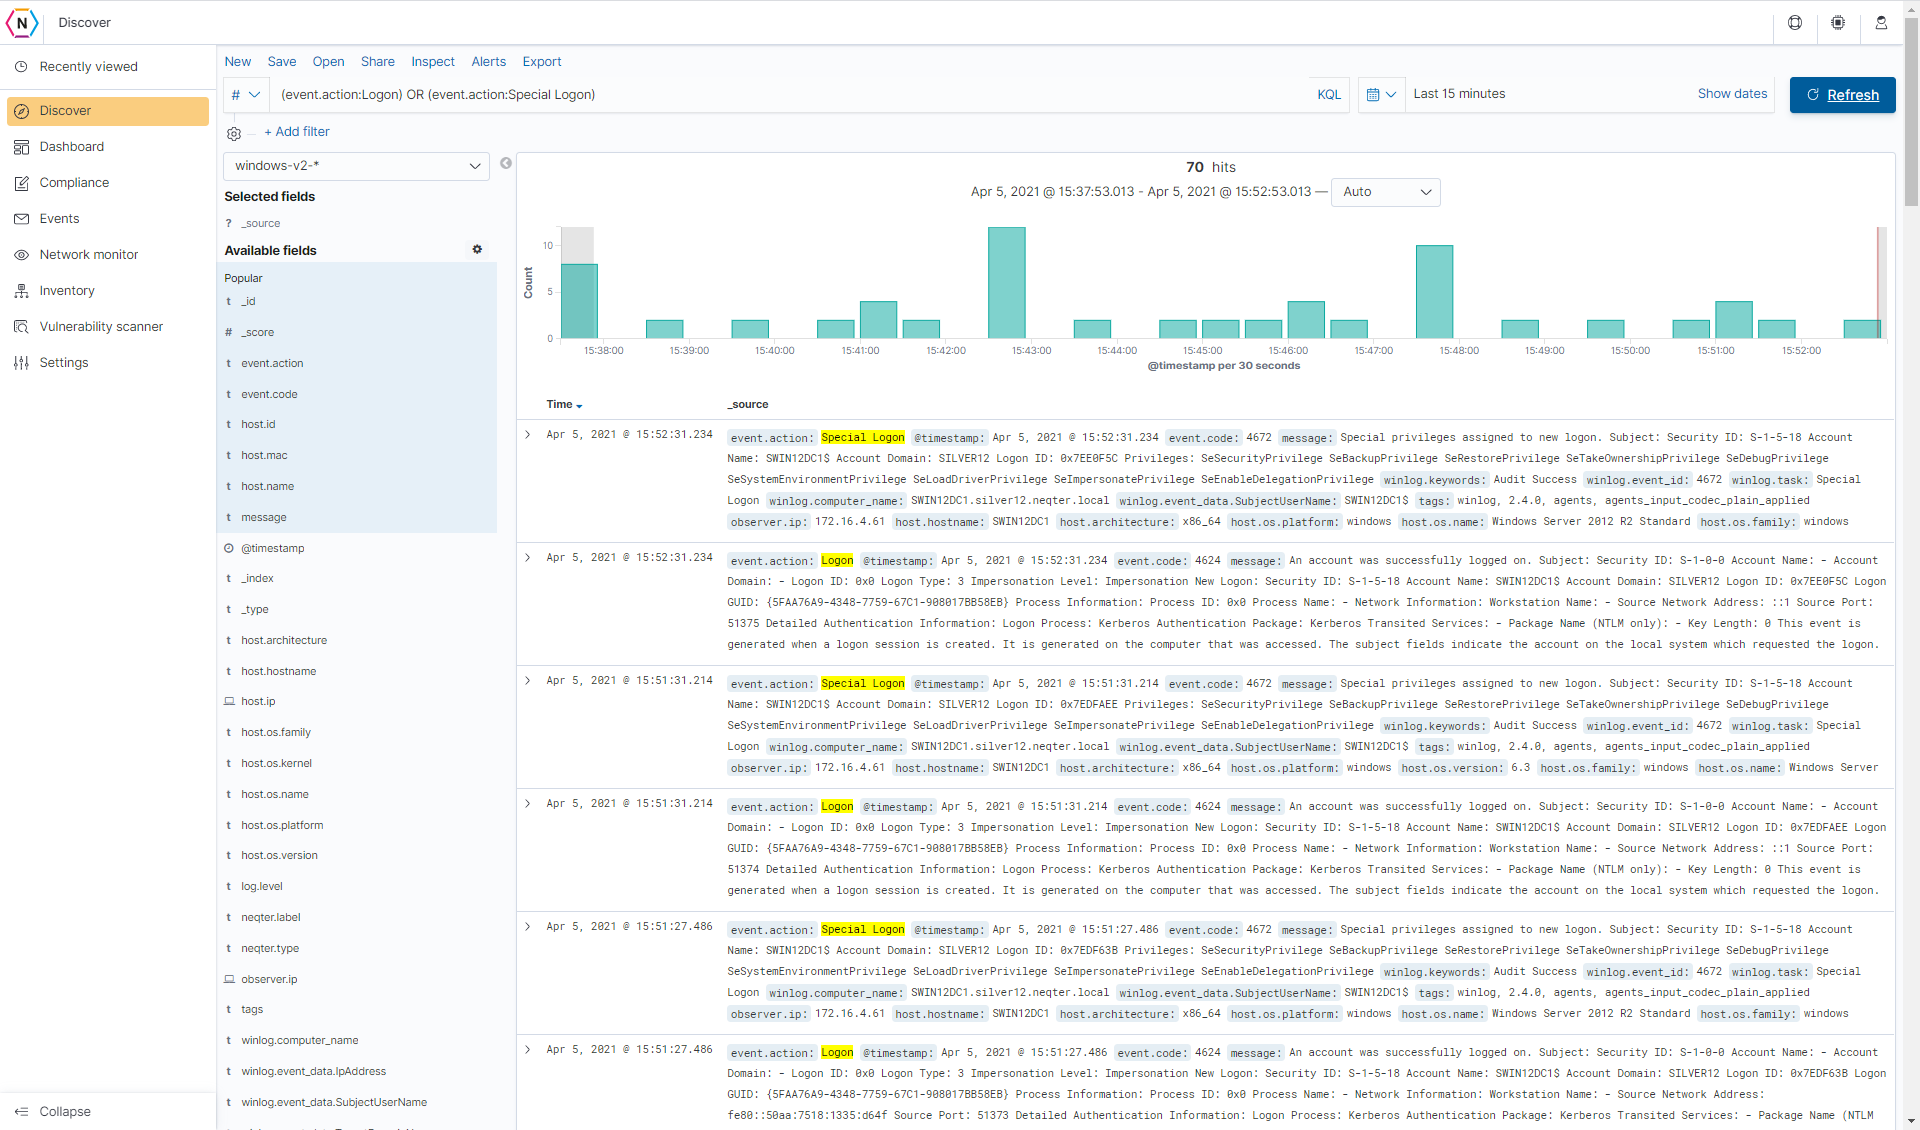
The Discover Page, represented by the compass icon which is the first icon on the left nav following the NeQter Symbol is where raw logs can found and filtered to either quickly sort through logs for relevant information or to use in creating searches which can be used to in the creation of alerts or for quick reference.
The Discover tab uses Kibana as its framework as well as the features that come with it, there’s a lot of different tools made available to you in order to help give you the best experience when interacting with Raw Logs.
Filtering Data
Instead of having to comb through tens of thousands of raw logs in order to find relevant information you need, Kibana allows you to set Filters and specific queries to narrow down the amount of data you have to look at. Not only does Kibana allow you to easily go through information, but it also allows you to do it through multiple different ways, giving you more freedom as to how you wish to tackle different searches.
Starting with Filters, you are able to use filters to sort through raw logs utilizing parameters created by the user to help with making the amount of logs to search through more manageable. Filters are made up primarily of 3 main parts; Fields, Operators & Values. These three pieces combined can create sophisticated filters which can be used to sort through your raw log data.
1. The first section found is Fields, fields refer to the section of the raw logs you’d like to search through with your filter. Each log is broken down into multiple different types of fields which you can use to sort through.
2. Operators are used to tell the filter what kind of sorting you’d like it to do. The most common two types of operators is the is and is not operators with is being used to show only logs containing a certain value and is not being used to only show logs not containing a certain value.
3. The Value of a filter refers to the exact data you’ll be referring to.
Creating a Filter
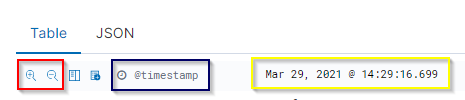
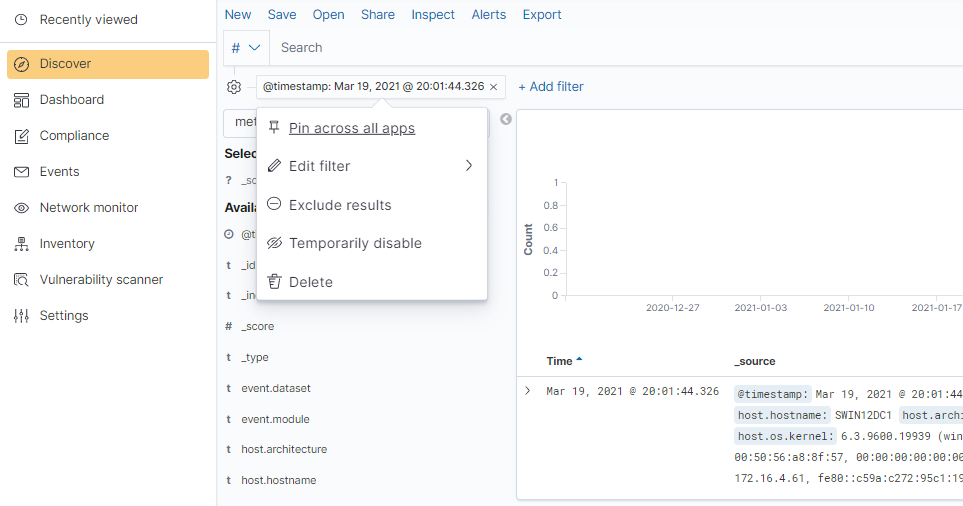
There are two main ways to create a filter on the discover page, the first being to use the Add Filter button found right below the search bar of the discover page and manually inputting the different parts of your filter. The second way is to open up a raw log, scroll down to the field you’d like to filter through with the corresponding value you’d like filtered, and then to either click the Filter For (Magnifier Glass with + Sign in center) or the Filter Out (Magnifier Glass with - Sign in center) buttons which will automatically create a filter for you.
Below is the two methods listed above in action:
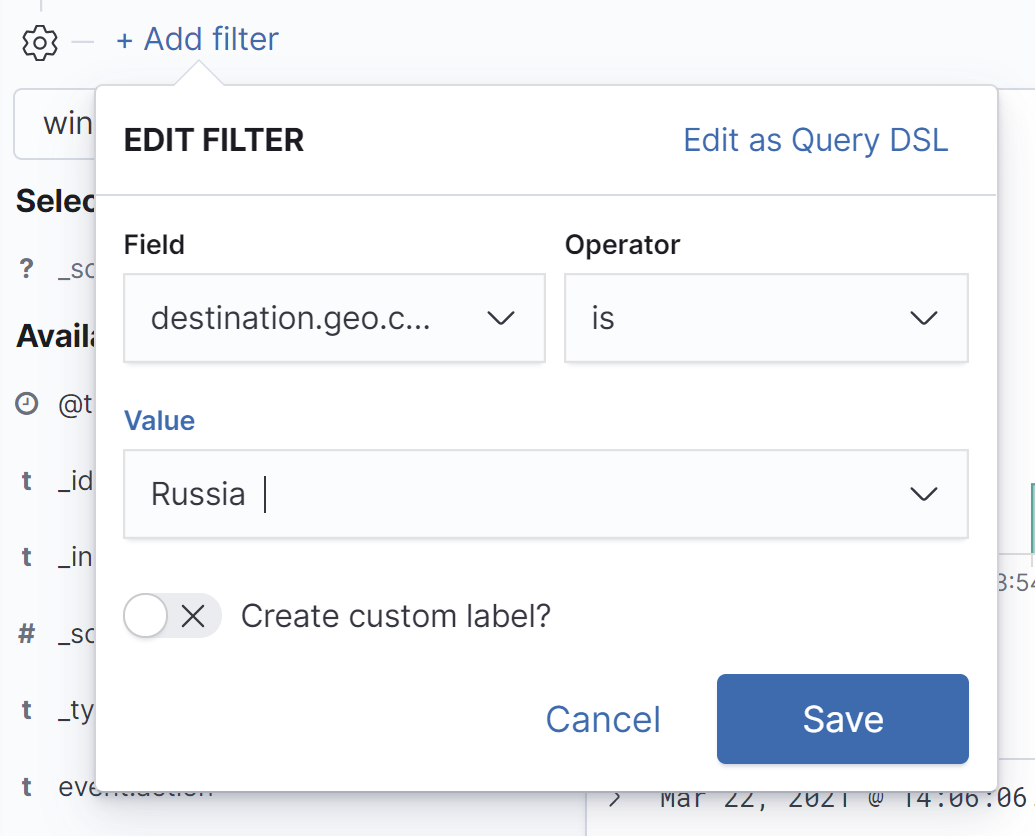
Creating a Filter Manually:
Creating a Filter via the Quick Use Options:
NOTE: The image is color coded as follows: Red Highlight for Operators, Blue Highlight for Fields, and Yellow Highlight for Value
You can have multiple filters in use at once as well as multiple values selected under one filter which leaves you with plenty of different options for filtering through data found on your device!
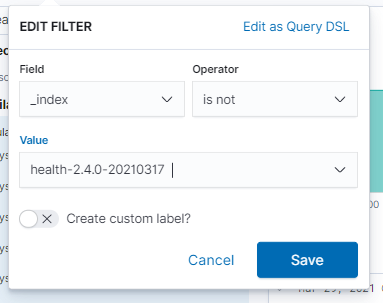
You can also create a customized label for it on the top by click on the Create Custom Label when editing a filter and then inputting the label you’d like to give it. Once you’ve saved the filter, you should now see it named to the label you gave it instead of the parameters.
Inverting Filters
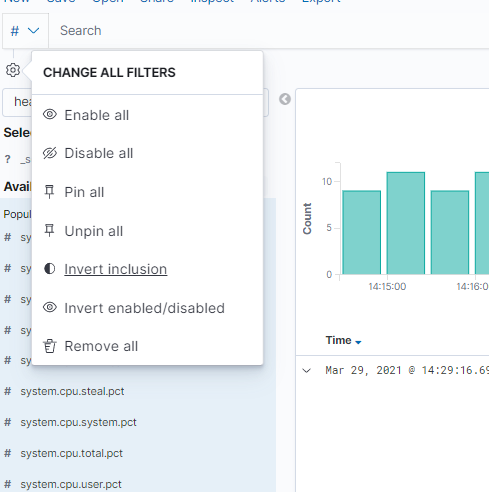
You can also invert already created filters. Inverting will simply change the Operator to the opposite of itself. So if you were filtering for a value it will now filter out a value and vice versa. You can Invert all filters currently created by clicking the cog right below the search bar and then click Invert Inclusion.
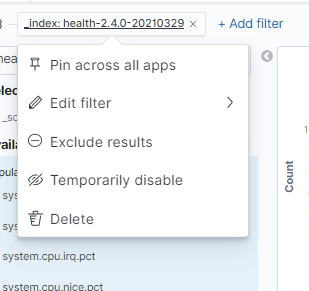
You can also invert specific Filters by clicking on the filters on the top and then clicking Exclude Results if it is using a is not operator or Include Results if it is using a is operator.
Pinning Filters
The Pin Button allows you to bring filters and/or fields over between the discover page and the dashboard page as well as between different dashboards. You can either pin all fields & Filters at once by clicking the Pin button under the top left cog icon or you can click one of the filters / fields you’d like to pin and clicking the Pin button found under them instead if you’d like to only have some filters / fields follow you.
Removing Filters
To remove a filter all you have to do is go to the top left, find the filter(s) you’d like to see gone and click on the x icon that appears on the filter box. If you’d like to simply deactivate a filter fast without removing it you can do this by clicking on the Disable All button under the cog wheel on the top left if you want all of you’re filters inactive or if you want only one filter disabled you can click the Temporarily Disable button which can be found by clicking on the filter you’d like disabled.
Searching Data
Another way to search through logs is by creating Searches using either Lucene or KQL Language on the top search bar found under discover.

Searches (also called queries), not to be confused with Saved Searches, work very similarly to filters in that it can be used to sort through raw logs on the discover / dashboard page. One major advantage Queries have over filter however is that they can be used to look for specific values found within a larger string.
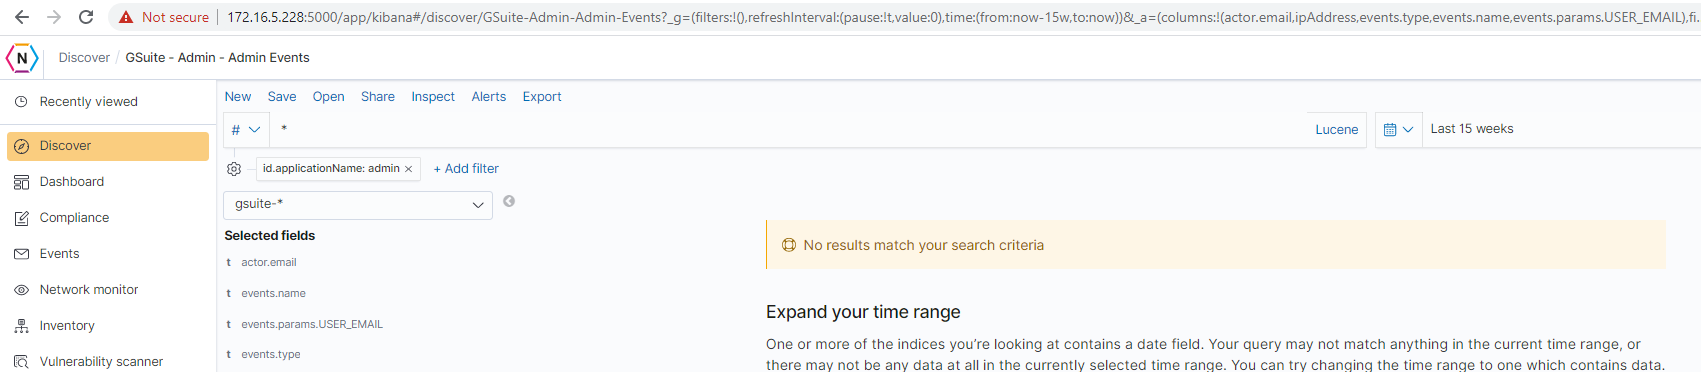
For example, if we want to only see Windows logs with the logon ID of 0x7E8BB80 found in their message field, the best we can do with filters is the following:
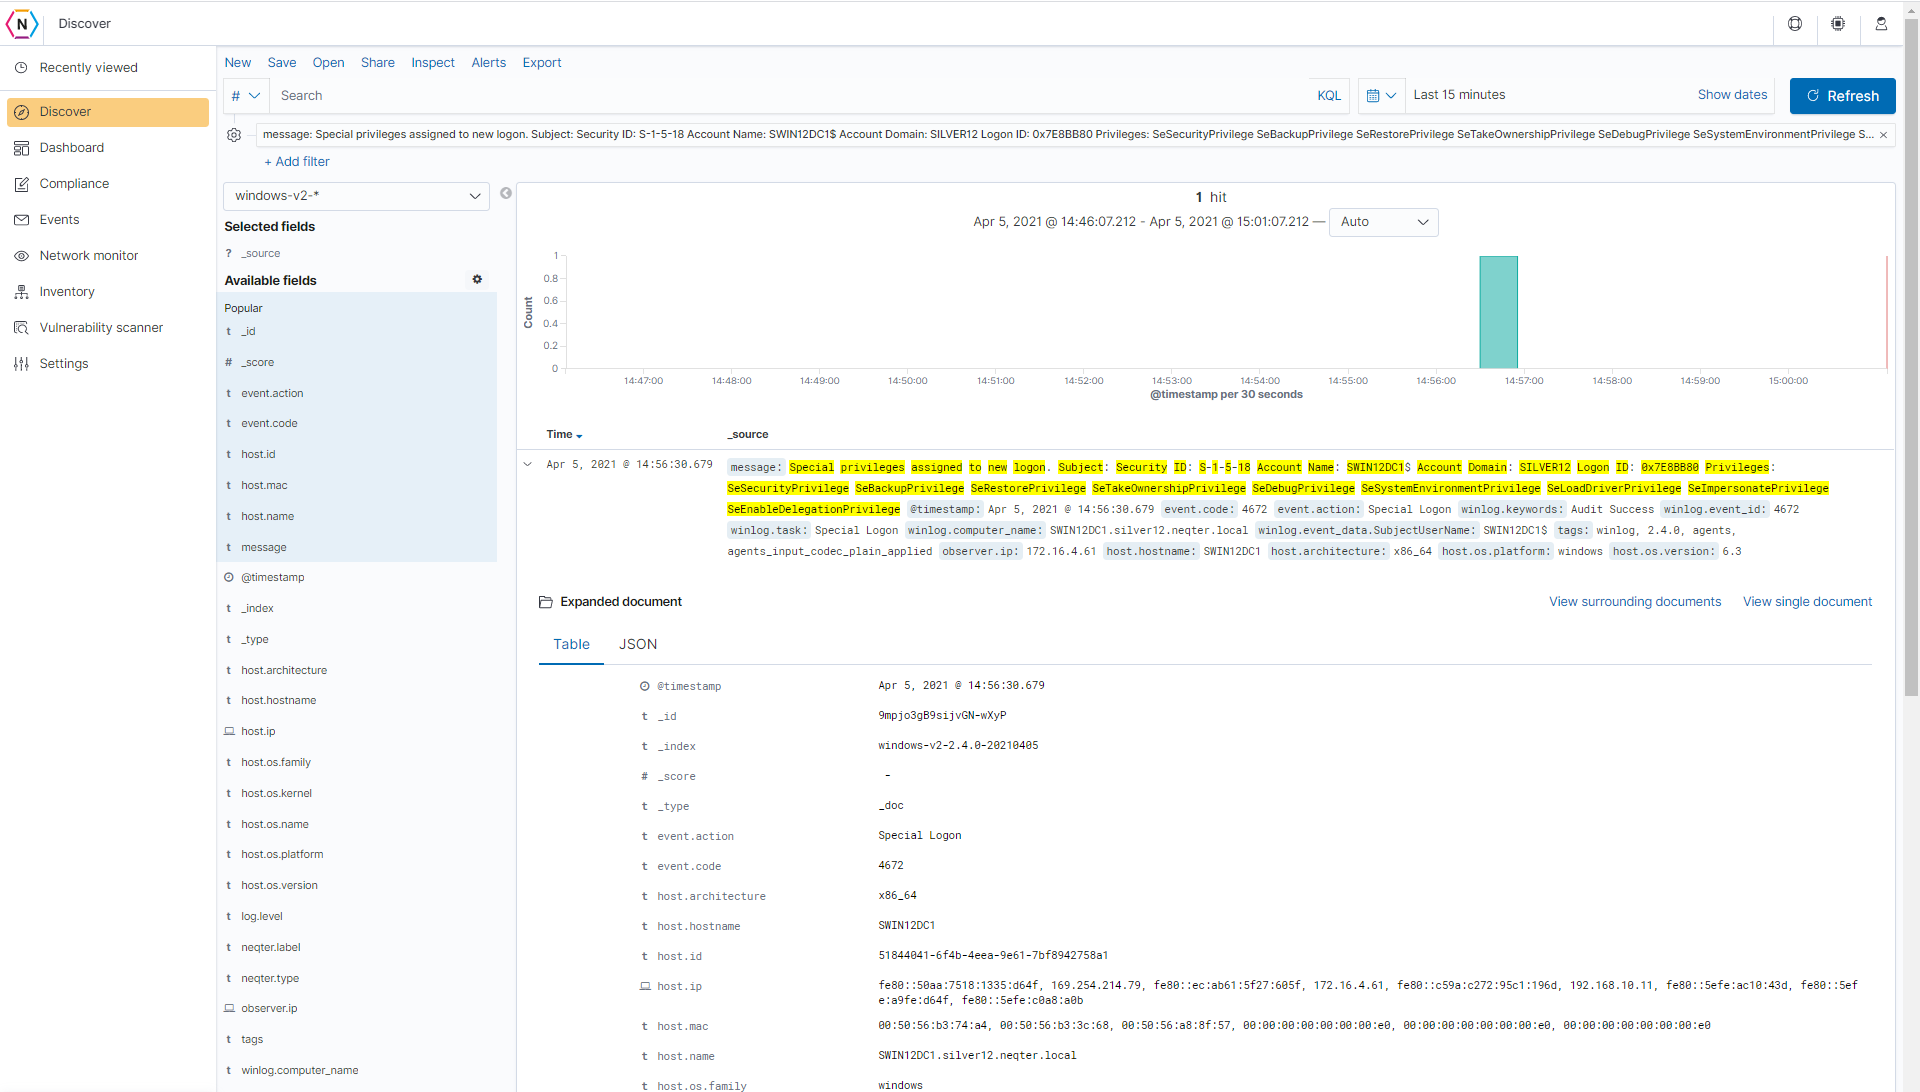
Sadly with filters this will use the entire message value and not just the logon id found under it. So to single out the specific value we want, we can add the Logon ID into the search bar with quotation marks and asterisks to the beginning and end of the value and now we will get the follow:
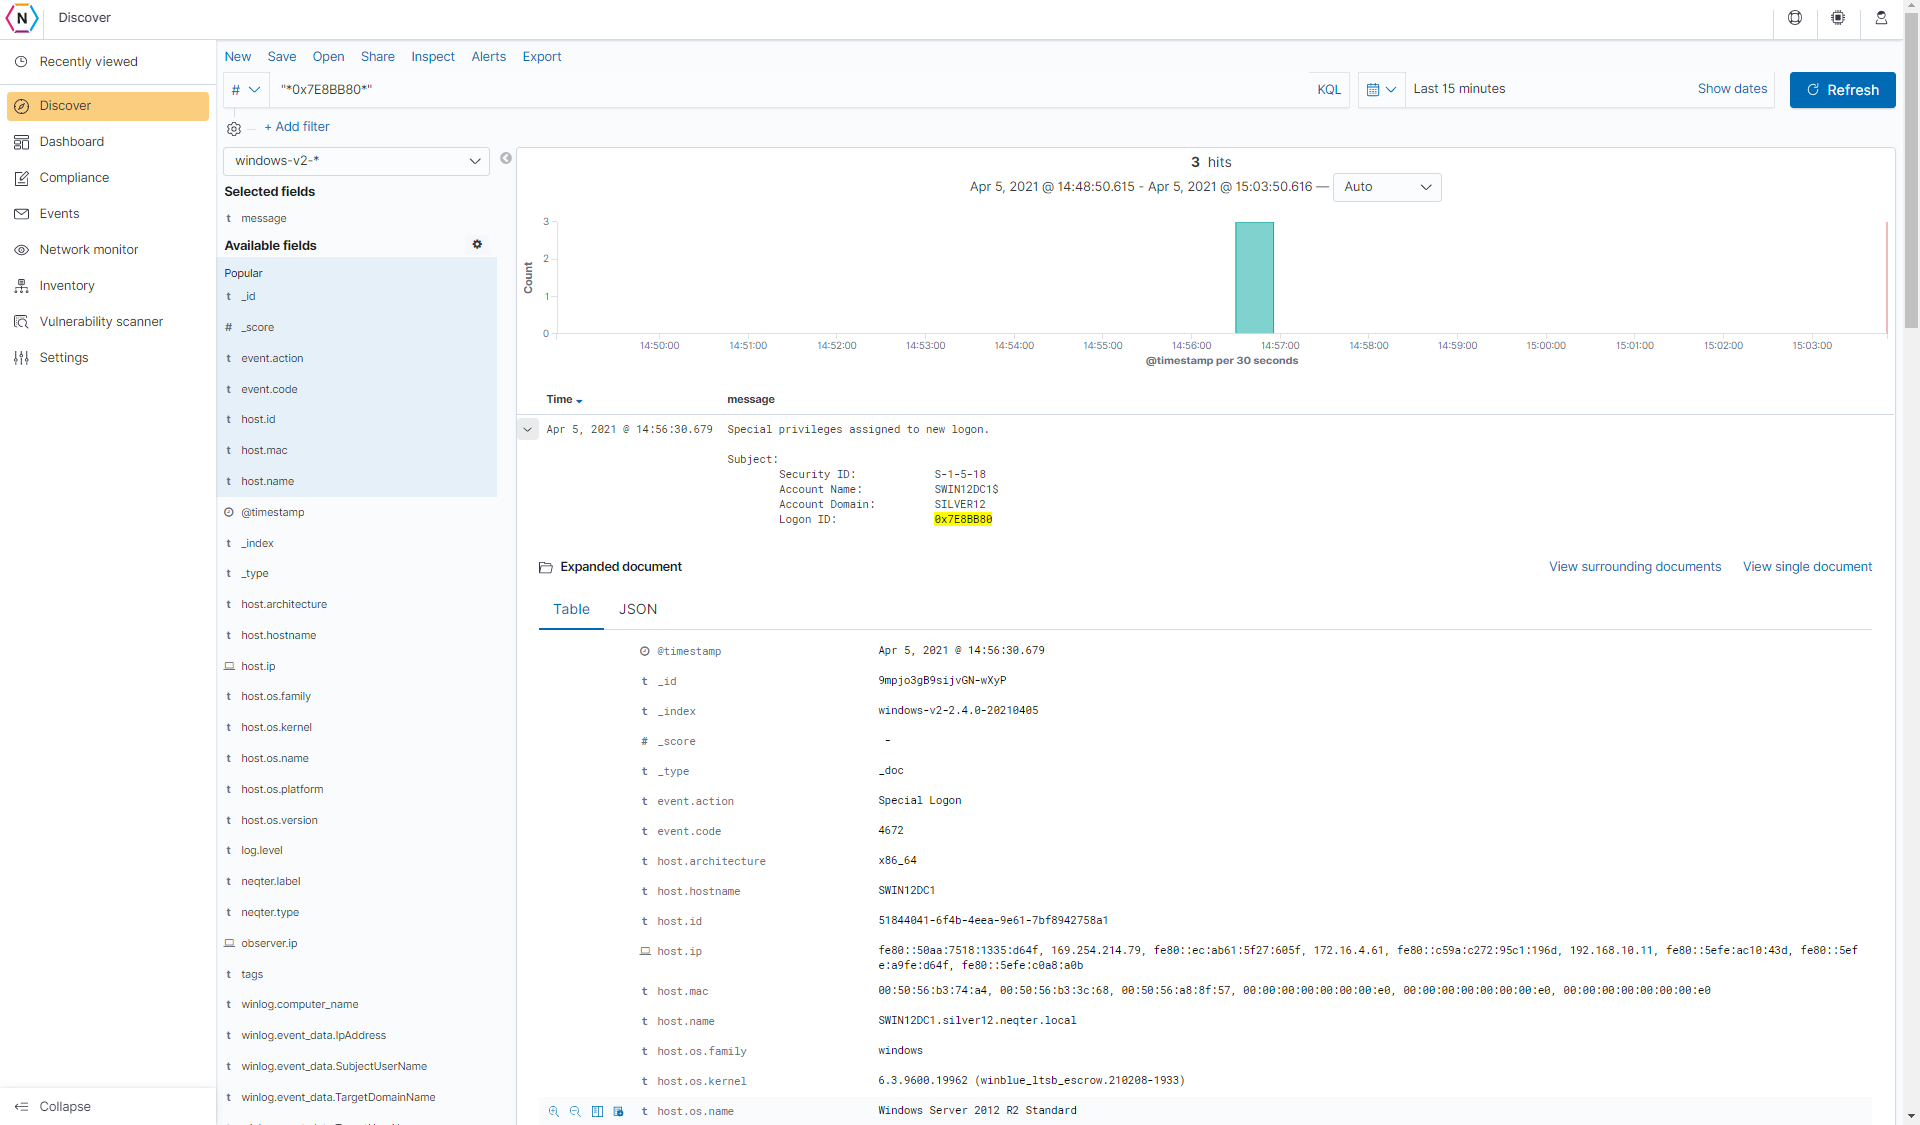
Now only the relevant information we needed is highlighted with everything else ignored in the message field, and this can be expanded or simplified as needed.
Because of this feature the search bar can be very useful, but one major disadvantage to the Search Bar however is that by itself it cannot be used in creating an Alert. In order for it to be used in a Alert it has to not only be saved in a Saved Search but also needs to have said saved search have at least one filter implemented in it as well. Even with these measures however sometimes the Query will not work properly in the Saved Search when generating Events and thus it is highly recommended to use only Filters.
Search Bar Syntax
To help with using the search bar, there are a few common syntax one can use in the creation of a query. It should be noted that syntax for the most part stays the same between using KQL or Lucene in the creation of a query but there can be some minor differences which will be included below.
You can switch between the KQL and Lucene language by clicking on the KQL / Lucene button the right most part of the search bar and then switching the Kibana Query Language on or off.
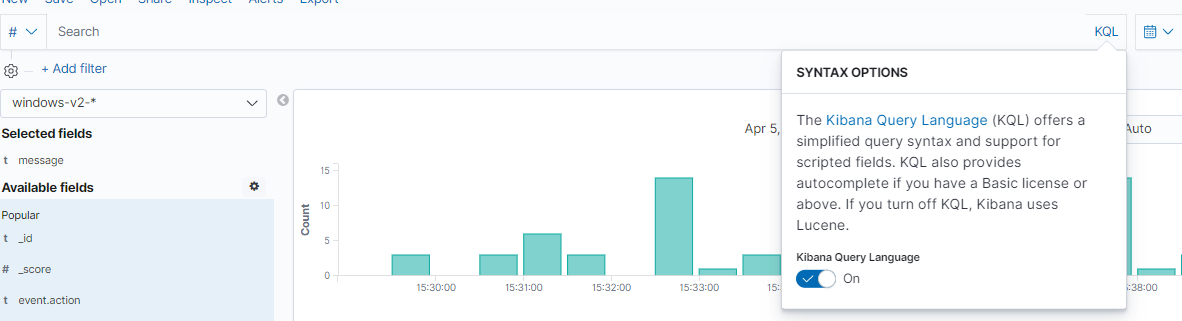
NOTE: One big difference between Lucene and KQL is that Lucene is very sensitive to spaces, it is recommended you do not put any spaces between operators where as in KQL this should be perfectly fine.
Finding Values in specific fields
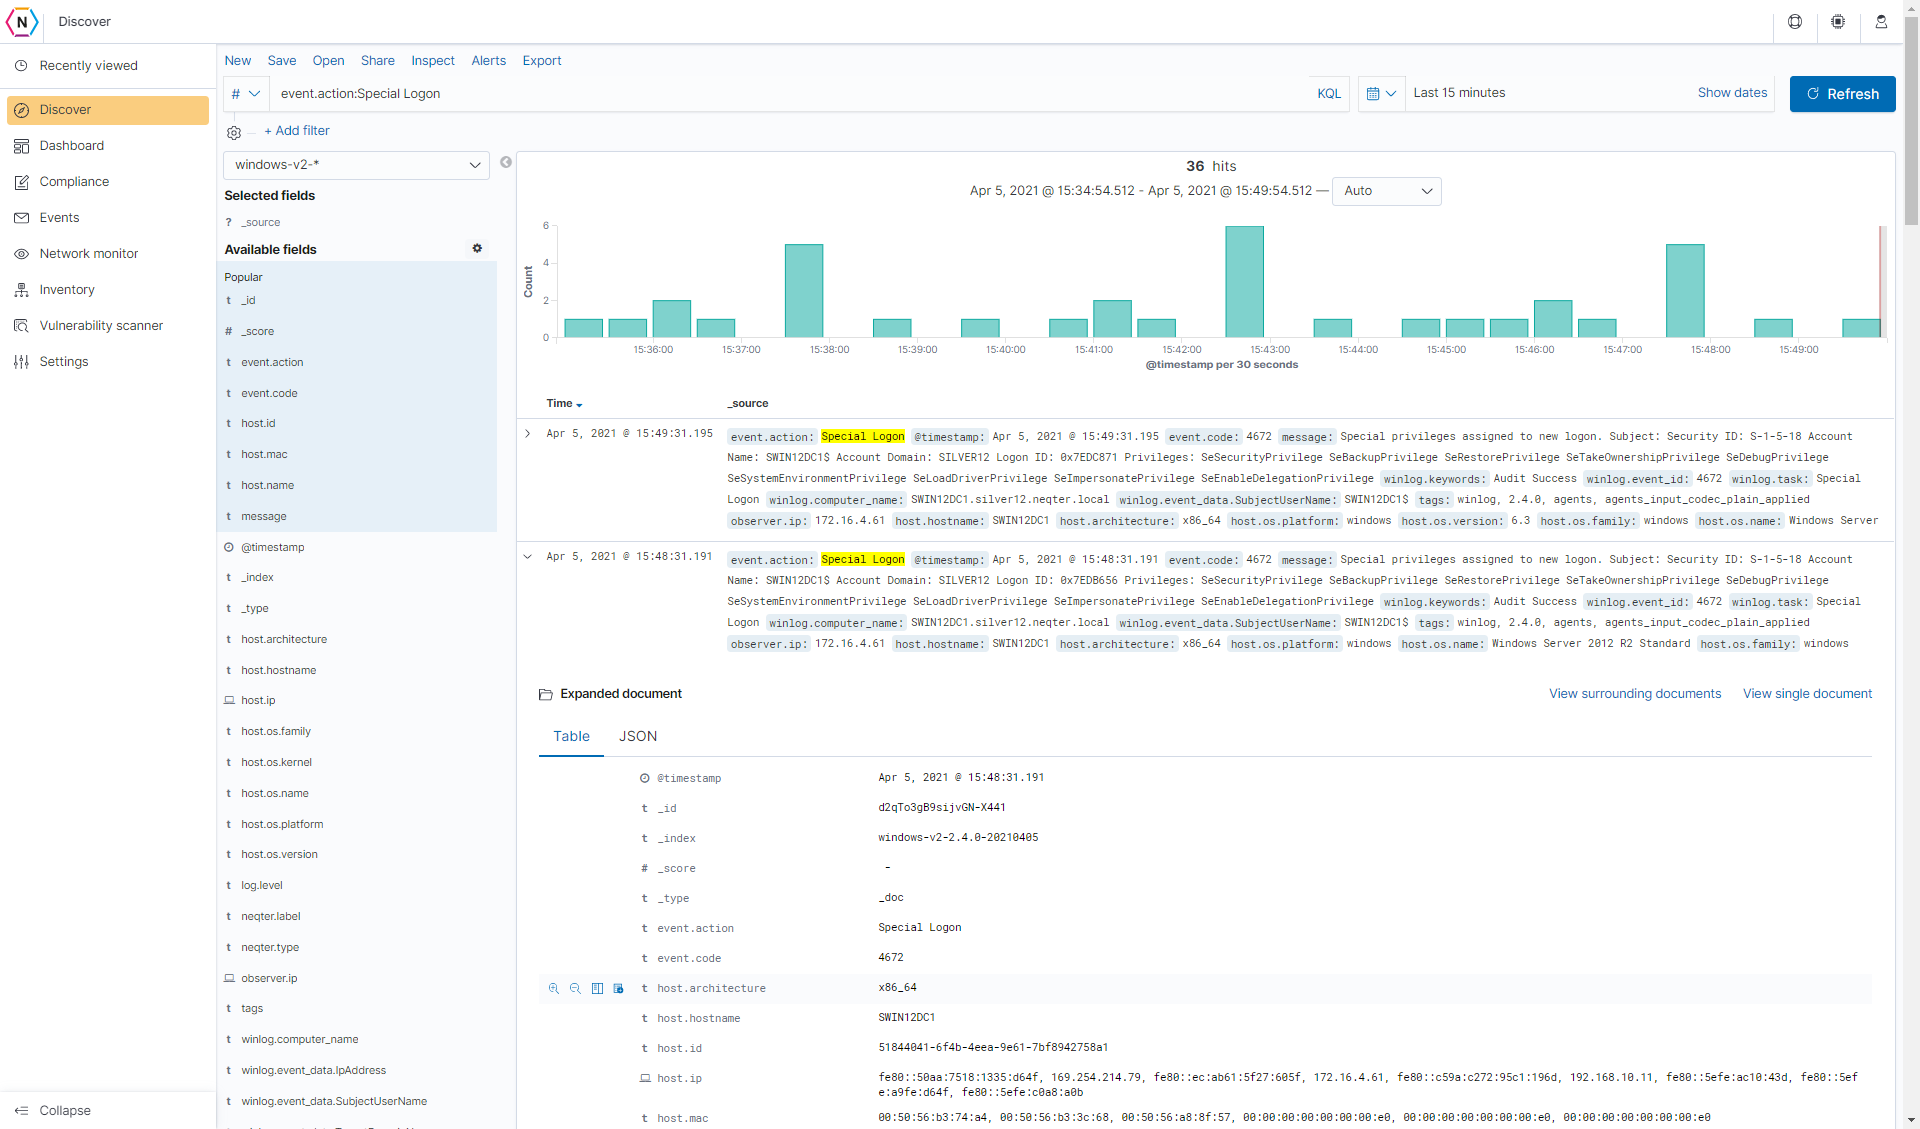
If you’d like to find values in a specific field you can put the field name before the value e.g. the query found below will only look for logs with “Special Logon” found under the event.action field.
Parentheses
Parentheses can be used to define multiple terms that you need to appear. The query below will find all documents that either show “Special Logon” or “logon” values under event.action field.
Wildcards
Wildcards (Represented by Asterisks ‘*’) are used to match just parts of a value, the screenshot shown earlier and below is a good example of how this functions. Putting an Asterisk before the value means anything coming before the term doesn’t apply and putting a asterisk after a term means anything coming After the term doesn’t apply to the search.
Quotes
Quotes can be used to look for very specific phrases, quotes are used when you are looking for exact matches. For example, if you were to search Our planet you will get results showing either word in any order but if you searched with “Our planet” then only results with those two words in the exact order will show up.
Time Range
On many of the pages that utilize Kibana to some degree such as Discover, Dashboards, Reports and Network Monitoring you will find a small Time Range section usually located near the top right of the screen. This is where you are able to edit the time range in which you’d like to see logs and other pieces of information from.
From left to right of the time bar you’ll see a Calendar which can be used to access the quick select screen, following the calendar there will be two set of times, the first set of time found on the left is where you’d like to have data start from and the next set of time found on the right side is where you’d like to see data up to. Finally there will be a refresh / update button which is where you can apply your new settings.
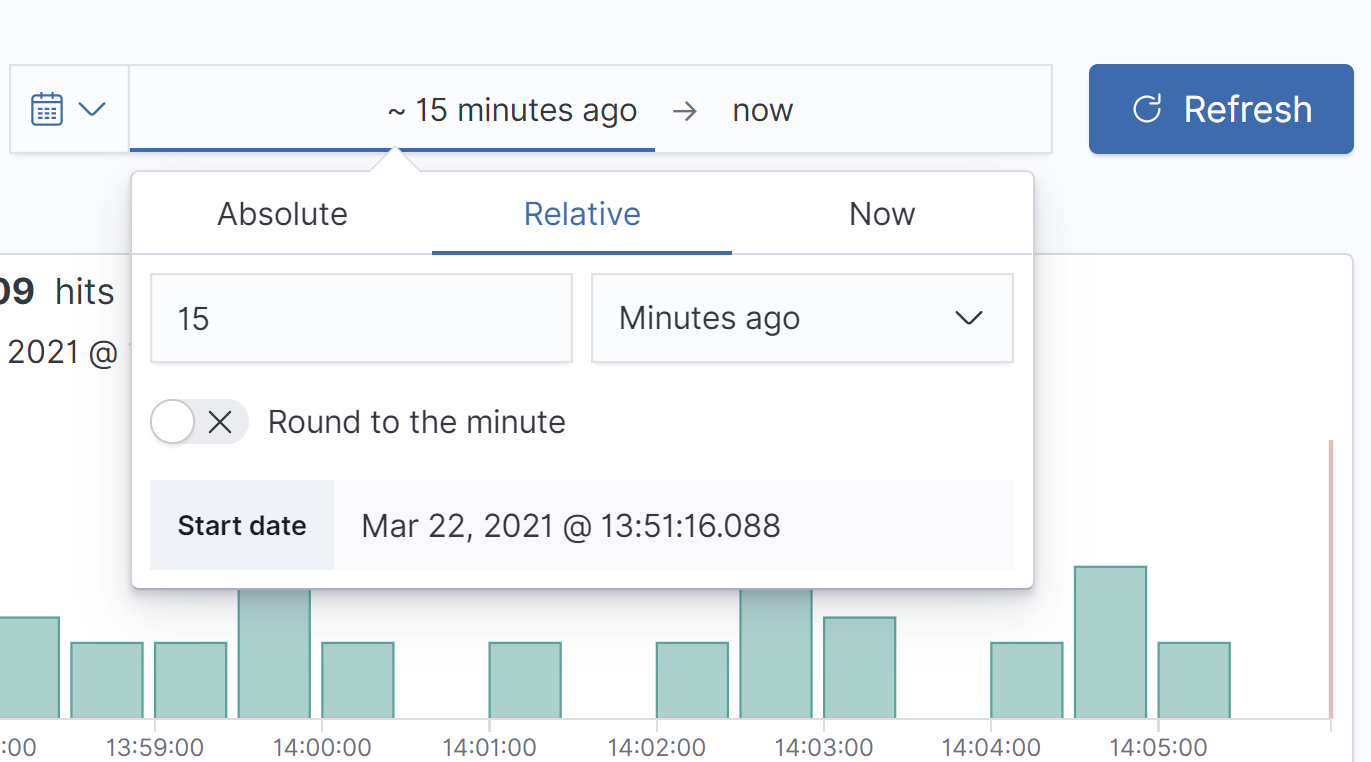
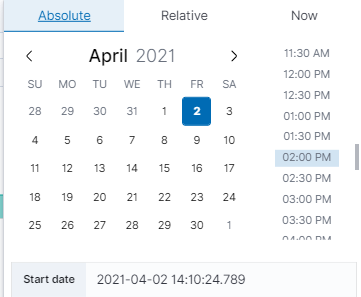
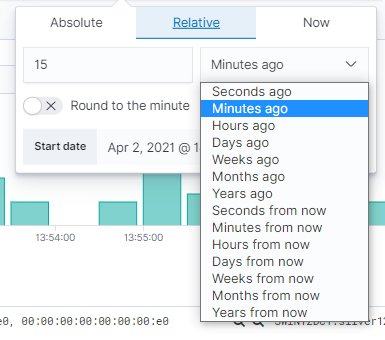
To edit the time, simply click on the start / stop time you’d like change and from there edit it to what you’d like. Both of them are split into three different sections, the first is Absolute time which is where you can set up the timeframe by selecting the exact time you’d like to use.
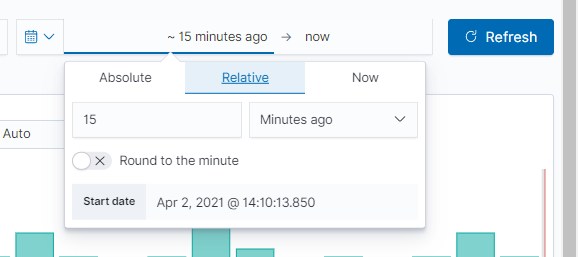
Next you have Relative time where you can setup your time to be relative to your NeQter Box’s present time. For example, if your relative time is set to 15 minutes ago then logs will only be shown for as far back as 15 minutes into the past. Finally you have Now which sets the time to the NeQter Box’s current time.
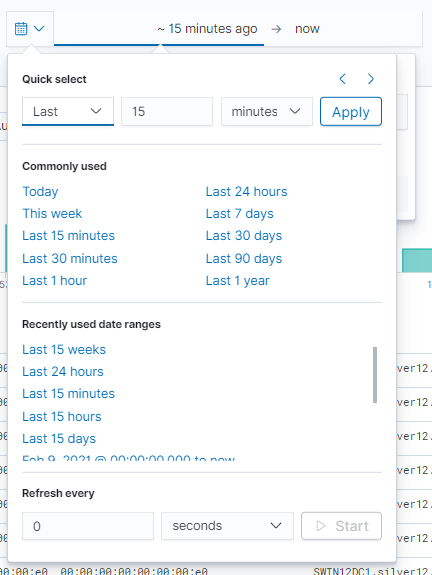
Finally if you’d like to setup a time frame quickly using either previously created time frames or presets you can do this by clicking on the calendar icon and then selecting from the options presented to you.
Once you have everything setup you can click on the Refresh / Update button on the top left to apply your new settings.
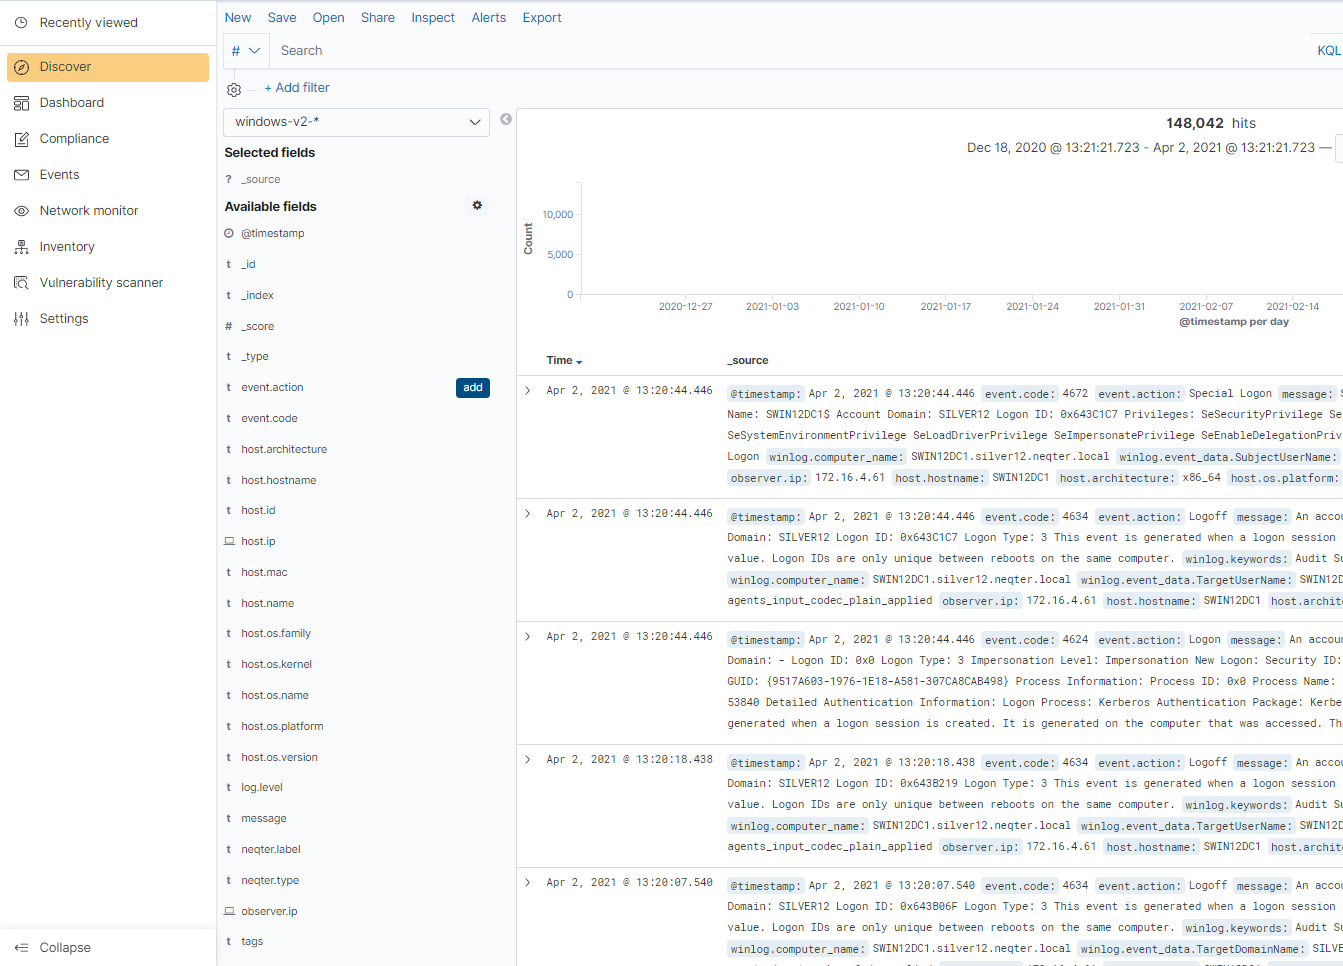
Using Fields
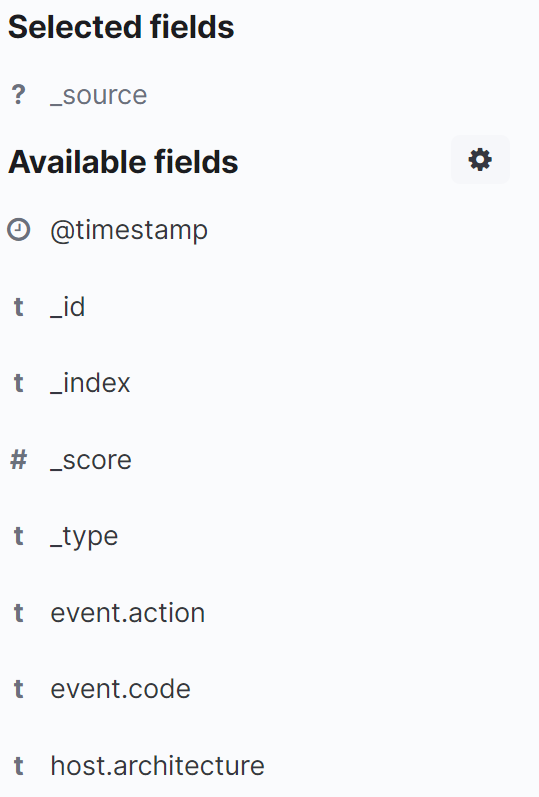
Using Fields you are able to choose what you’d like to have logs show you when looking at the index found at the center of the discover page. You can use this in order to help see information you might like to see first instead of having to open up raw logs to see specific bits of info you might be searching for. By default no fields are selected for each of the tables and so by default as much of the log’s information is shown on screen in one go.
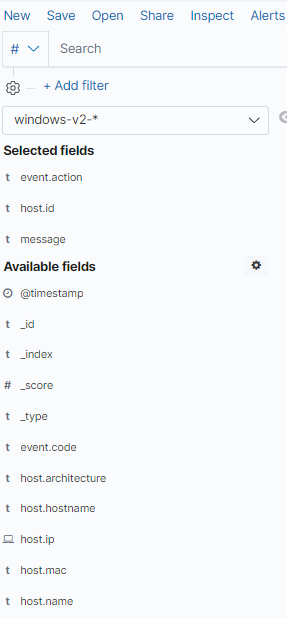
To begin organizing your fields there are two options available. One option to organize them is by selecting which field you’d like shown by clicking on said field on the left side nav of the discover page which will create a new field column on the raw log table.
Field being added:
Result:
You can also do this same process by selecting a field in the raw log list you’d like to have used and then clicking on the Toggle Column in table button to the side of the field.
Removing Fields
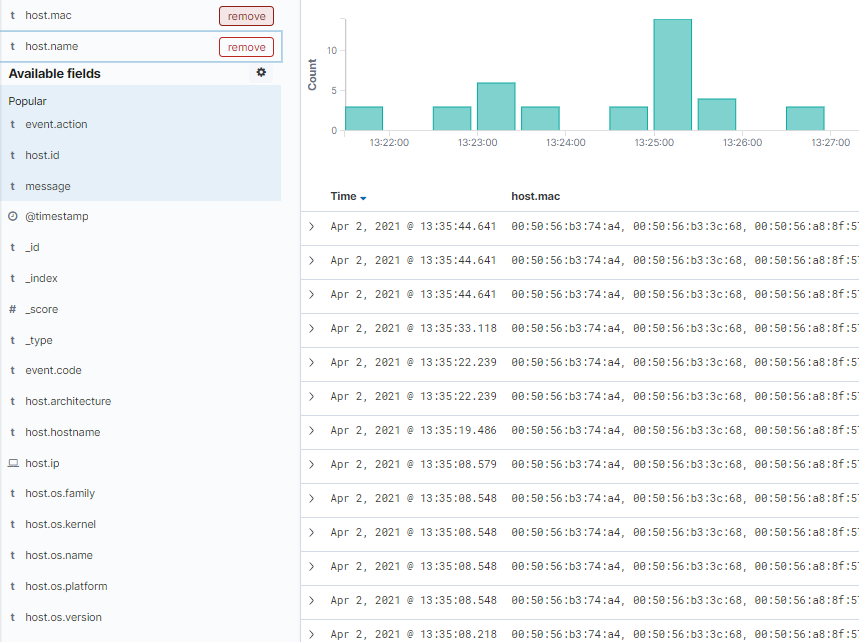
To remove field columns you’d like to no longer have shown you can go to the top right corner and under the Selected Fields section you can remove the field(s) listed there by clicking on the Remove button that appears when hovering over each field.
Viewing your data
When viewing logs we suggest using the many features we talked about previously to narrow down your searches. Using Filters, Fields and changing the Time Range of your search you can narrow down onto which logs you’d like to take a in depth look at.
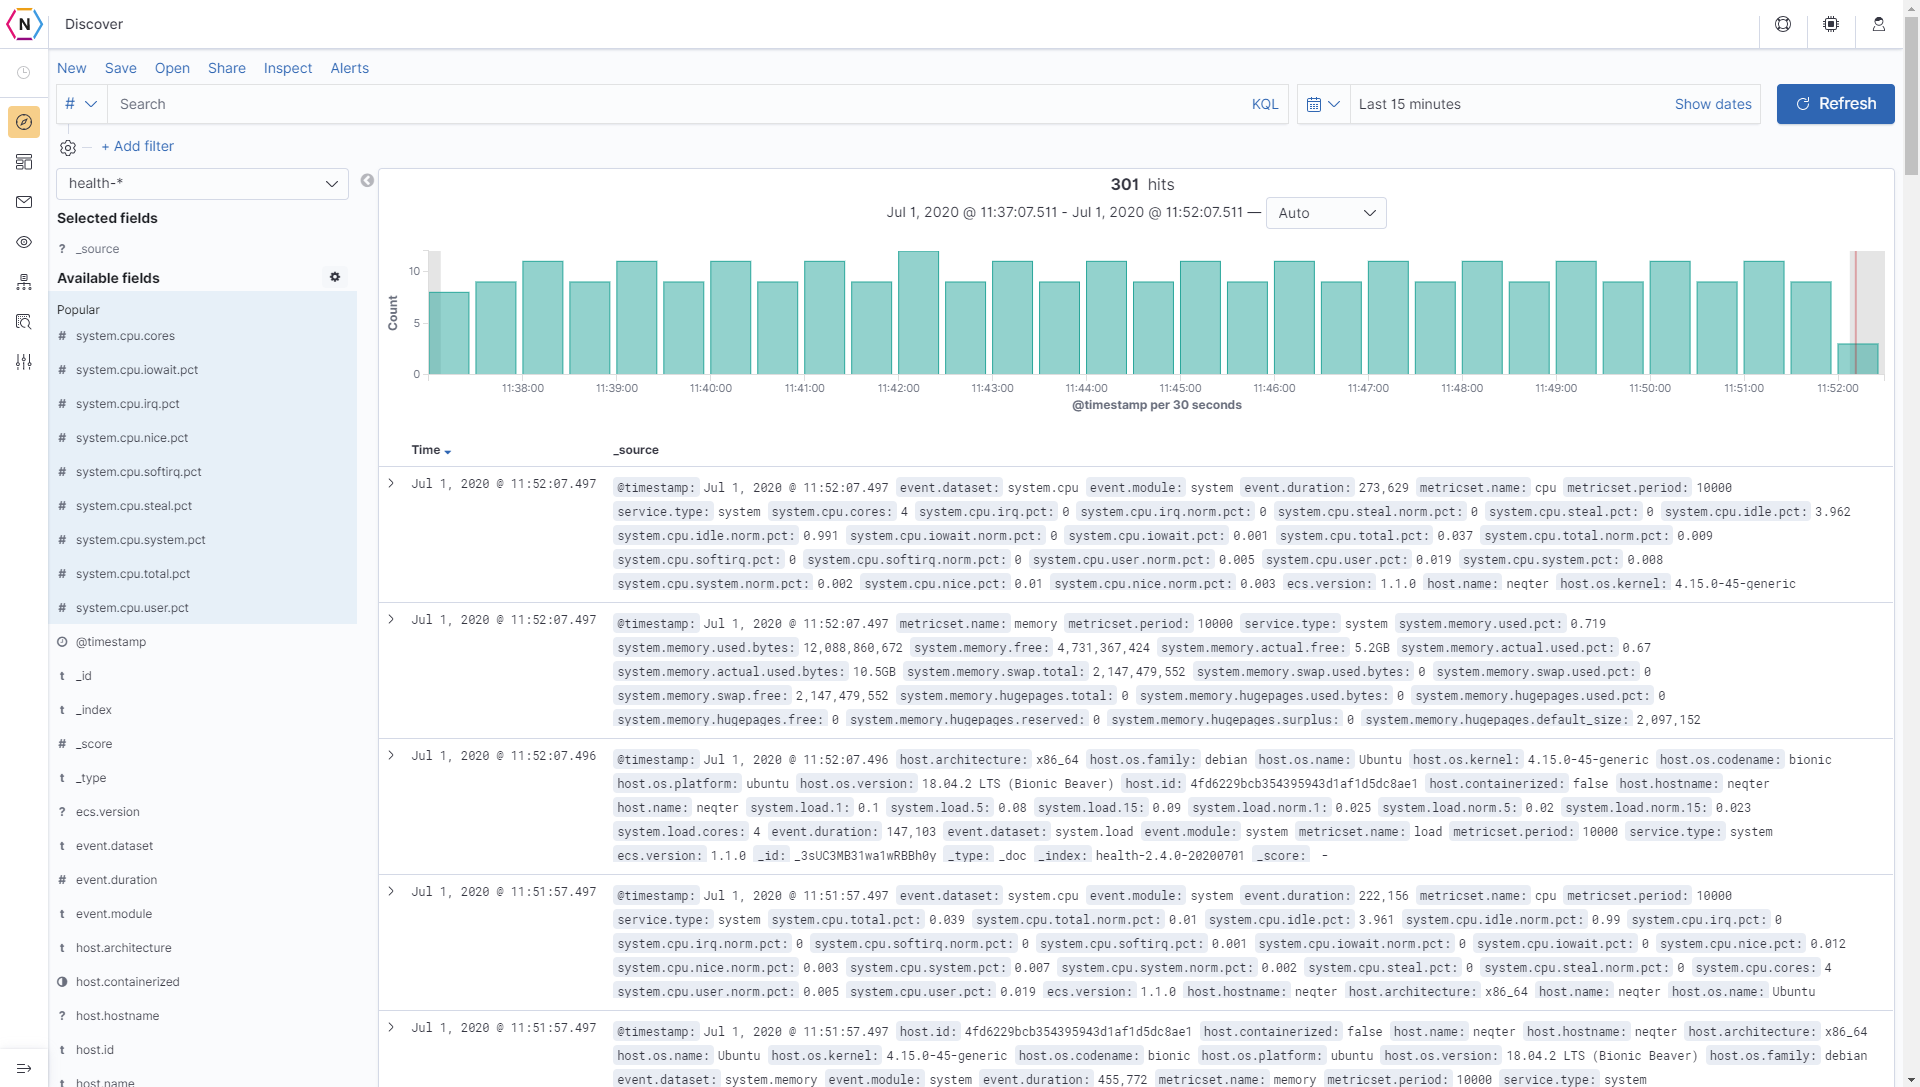
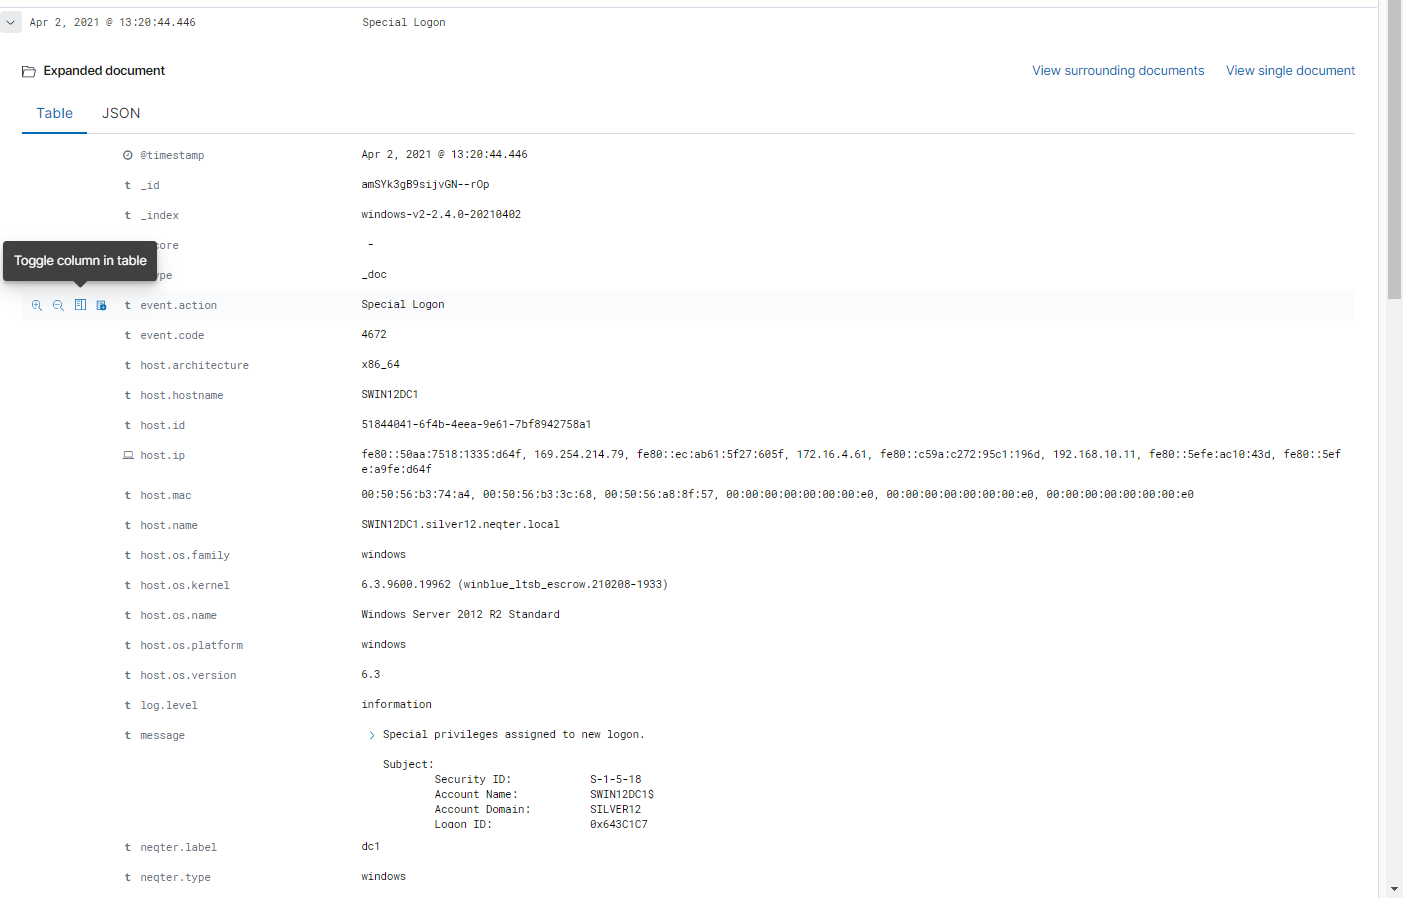
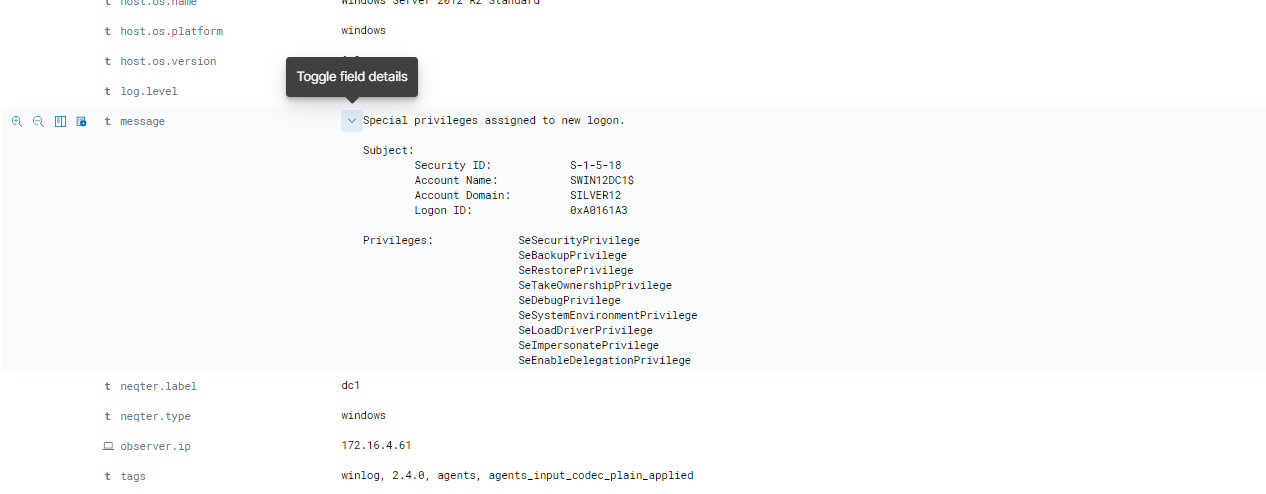
One thing to note is that when opening up logs (which can be done by clicking on the little arrow next to the time stamp of each individual log) you can also expand some fields (such as the message field) to see more information. You can tell which fields can be expanded by the little > you’ll see next to them.
Below is an example of a opened field:
Saving Searches
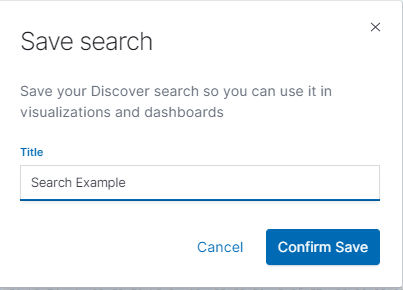
The Save Button on the top nav is where you are able to save the previously created filters, queries, etc. These saves can be used to create new Alerts or to use as a quick reference for later use. To create a saved search, simply click on the Save button located on the top and then give your new search a name and click save.
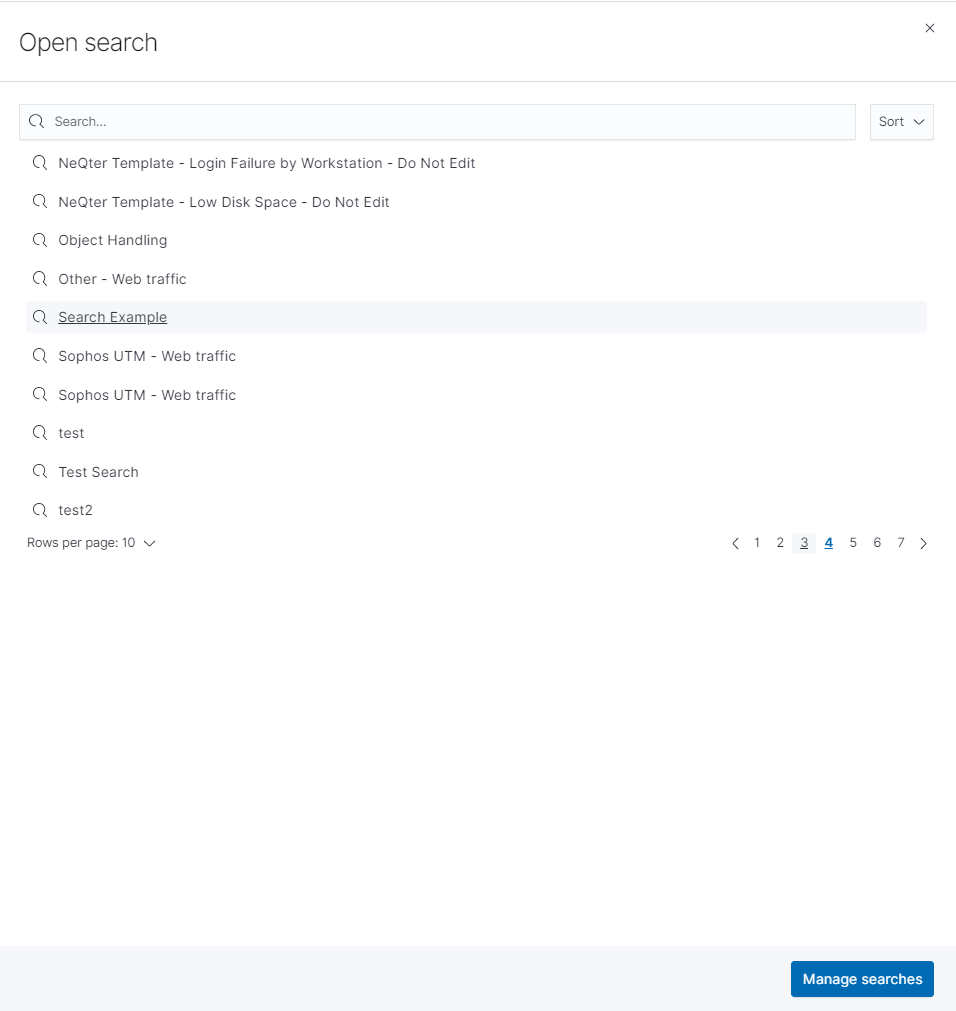
To open up previously created searches you can find them all located under the Open button located next to the Save button.
If you want to leave the current search you’re on click on New on the top left which will bring you back to the health page with no filters, searches and fields enabled.}
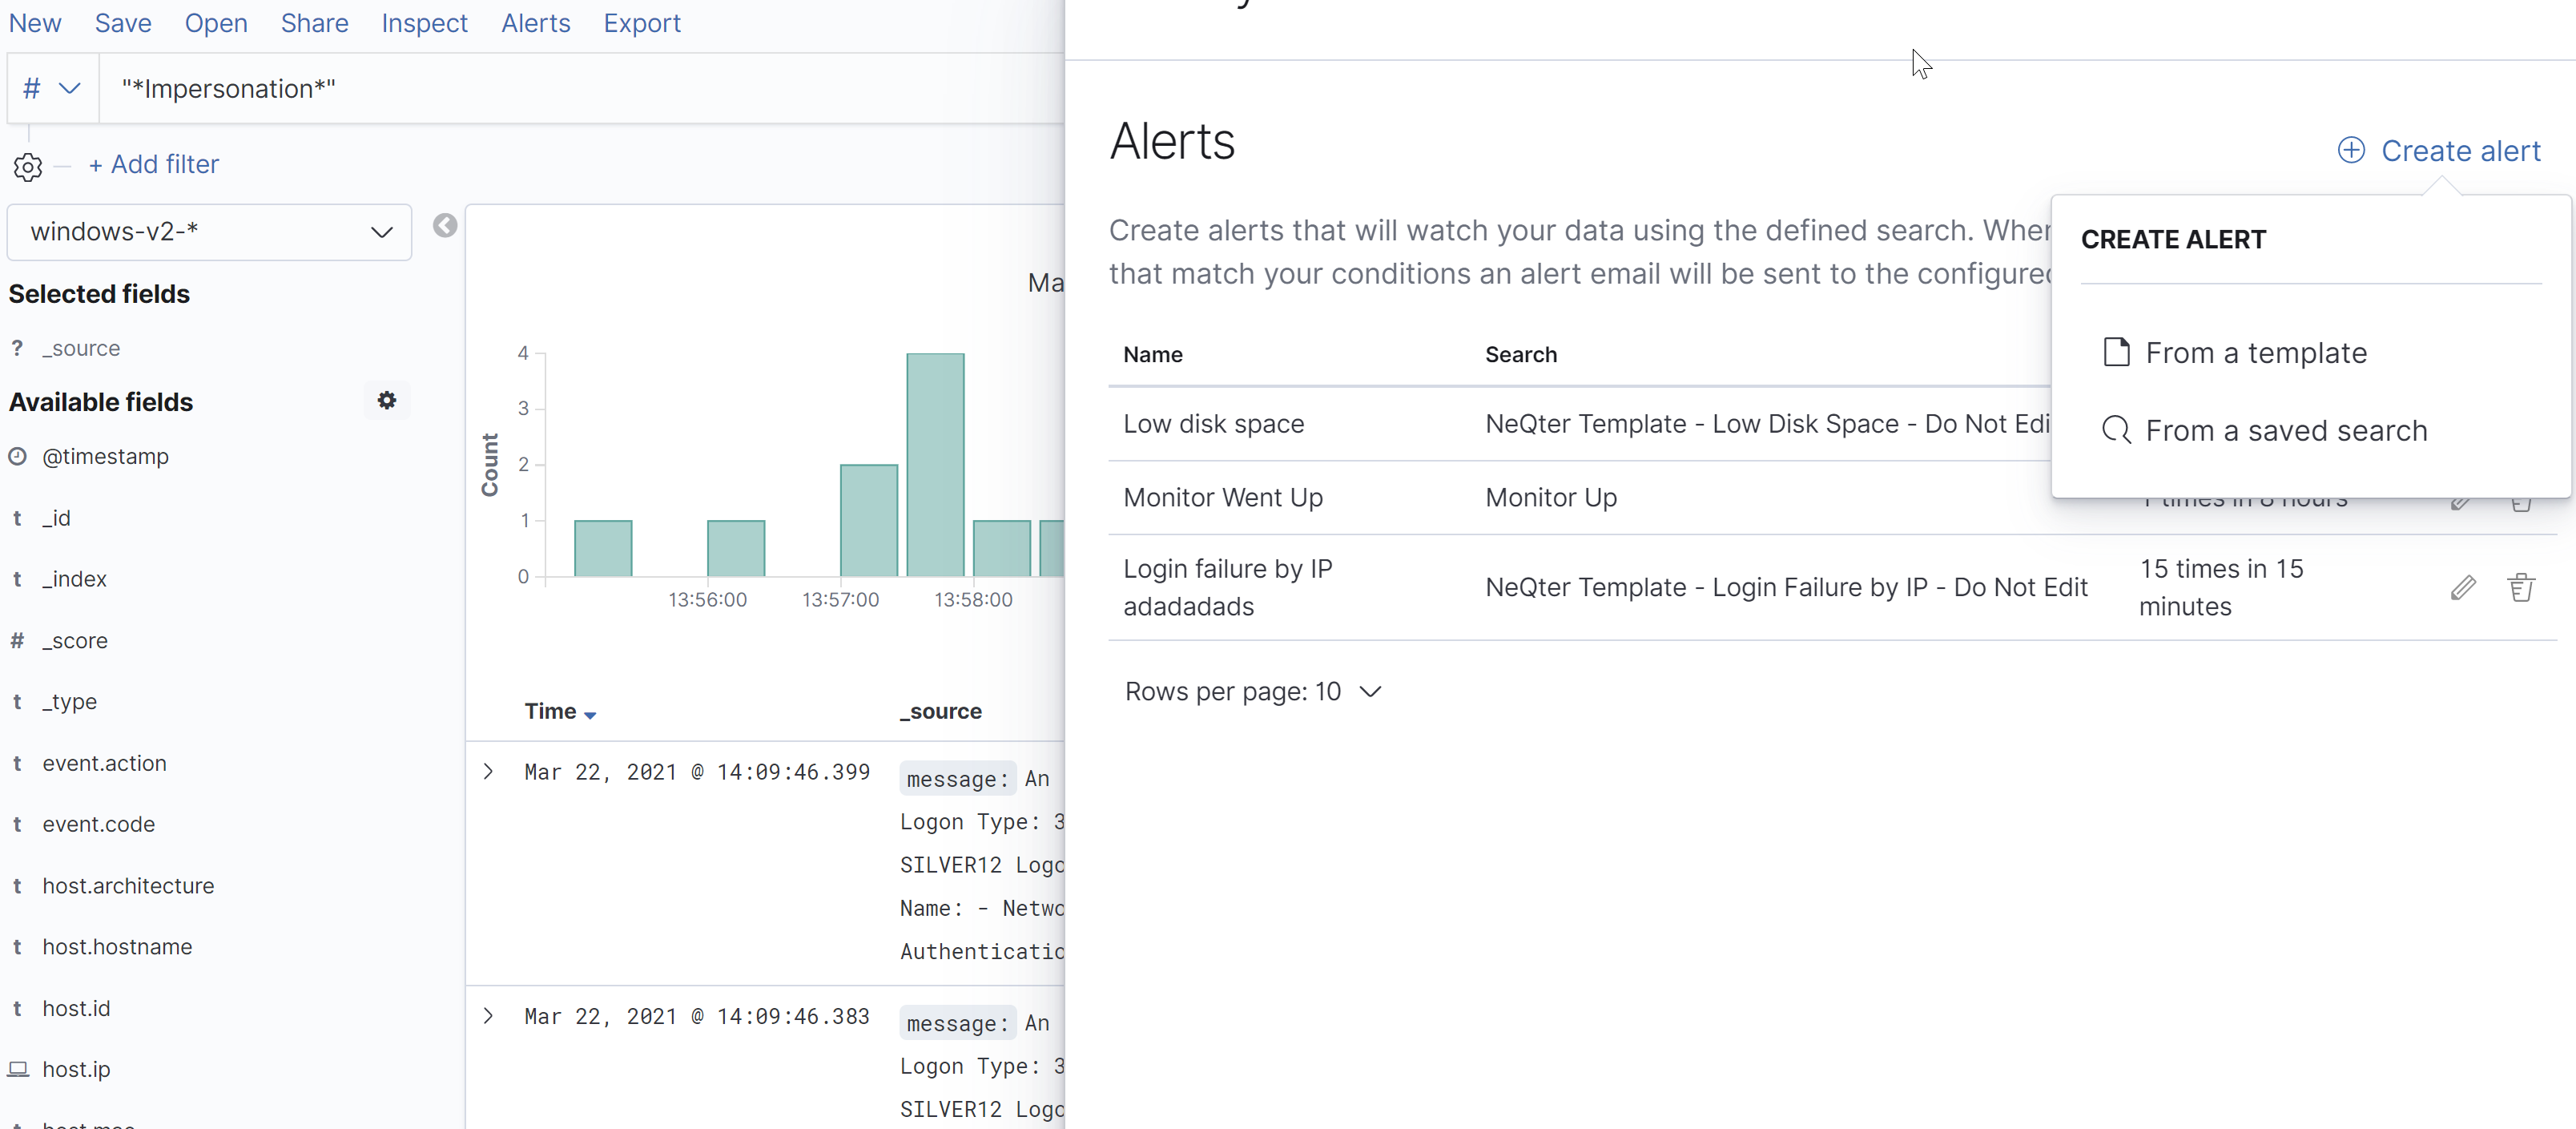
Creating Alerts using Saved Searches
Using Saved Searches you can create Alerts from the data collected on the Discover Page which you can use to keep tabs on what is being collected without needing to thoroughly check everyday for changes.
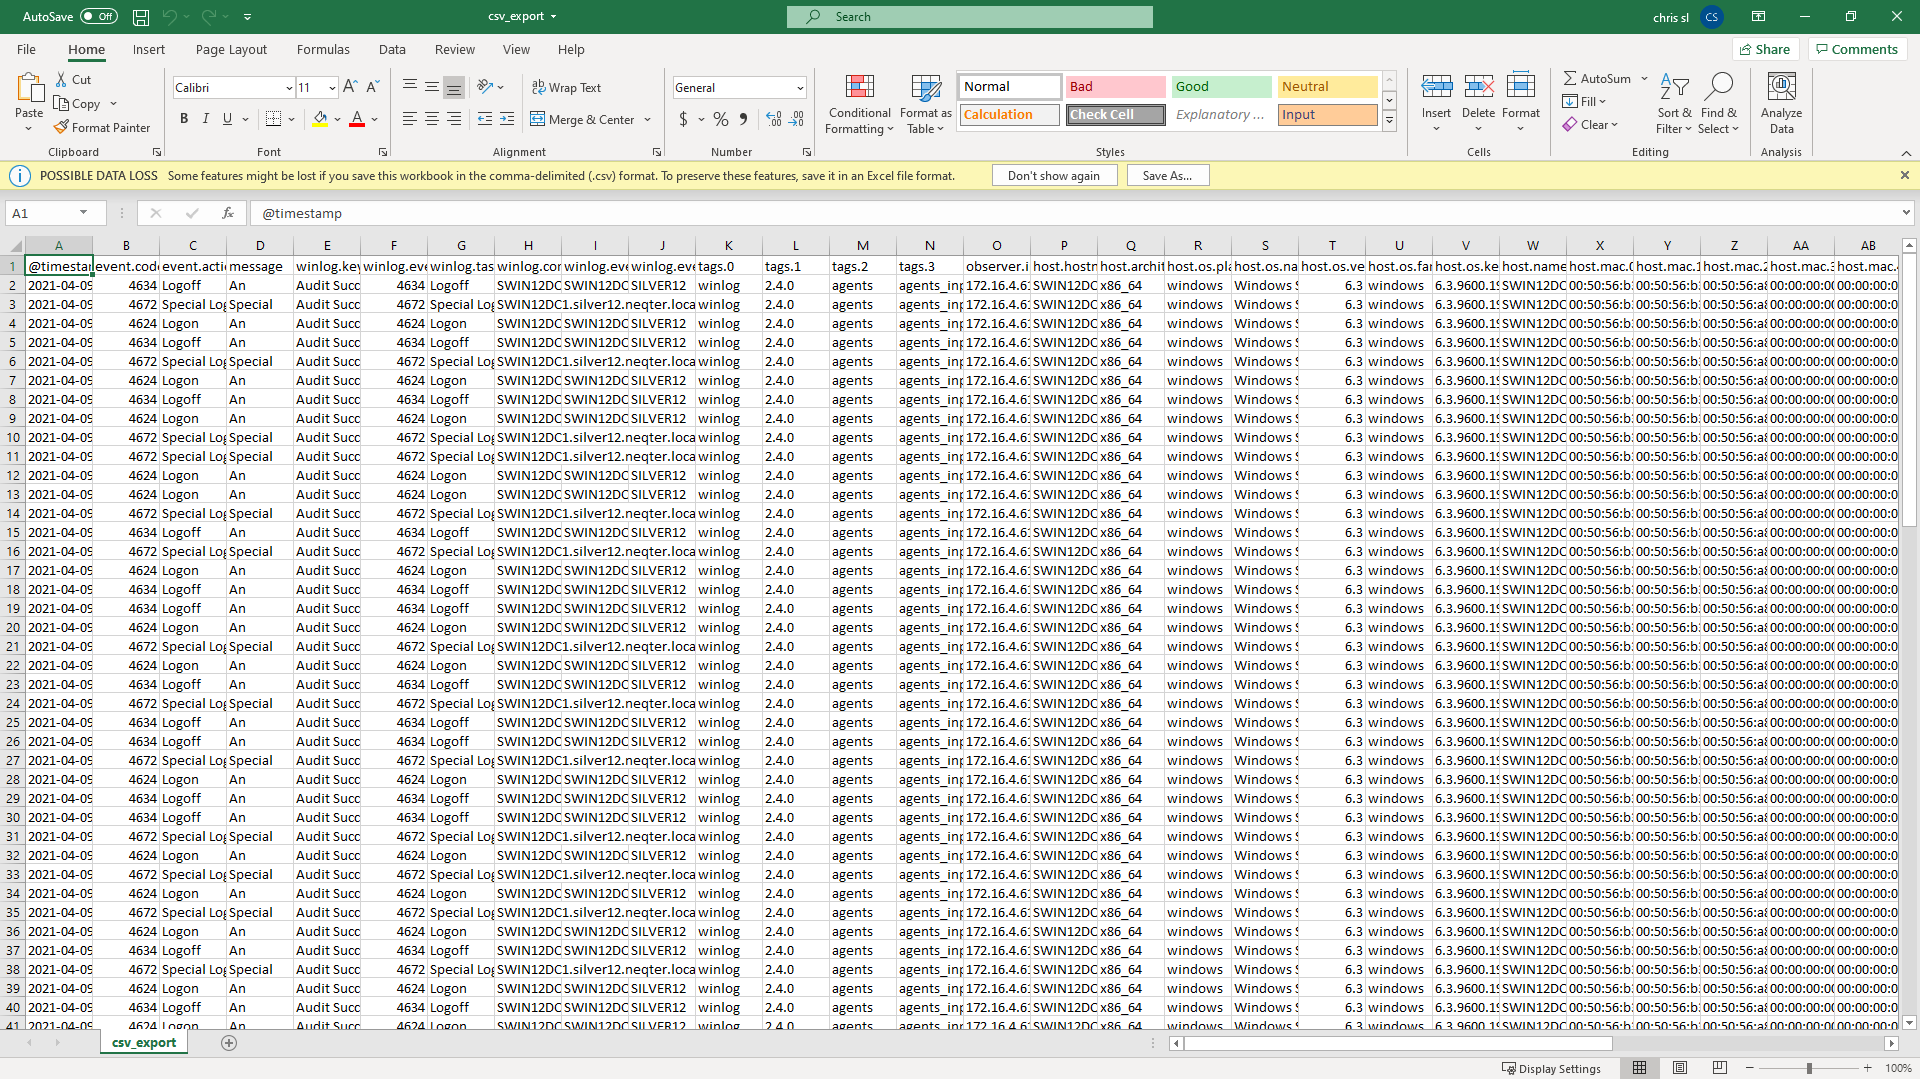
Exporting Data
The Discover tool also allows you to export up to 10,000 logs at a time directly to your device in CSV or JSON Format. The logs it will pull from are the logs currently being shown on the page, and if there is more than 10,000 logs present on the page then it will grab the first 10,000 logs listed.
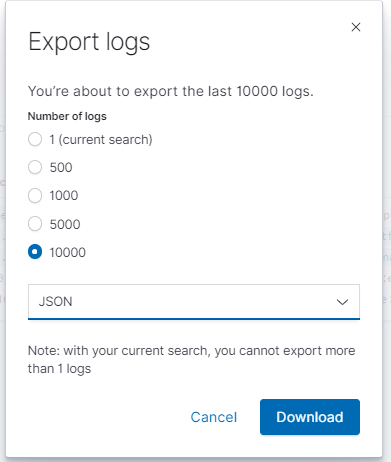
NOTE: If you have more than 10,000 logs present you should break down the logs further to help grab the ones you really need exported, you can do this by narrowing the time frame, using filters or using saved searches.
Sharing
The share button allows you to create a snapshots which can then be sent via URL to allow yourself or others the ability to view the discover data presented when the snapshot took place. Some examples can be seen below of the different method results:
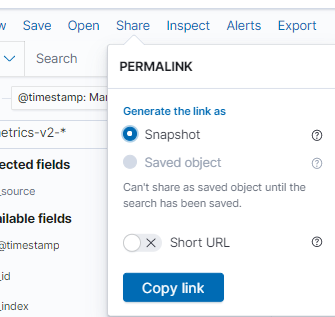
Snapshots
Snapshots can be taken anytime, once you have the url you can send said url to anyone in the same network and they’ll be presented with the same screen you were taking a snapshot of.
Objects
If you have a search already created and saved you are able to take a object snapshot instead, which not only brings the user to the same page you were on but also the same search settings!